3.1The Purification of Proteins Is an Essential First Step in Understanding Their Function
The Purification of Proteins Is an Essential First Step in Understanding Their Function
An adage of biochemistry is “Never waste pure thoughts on an impure protein.” Starting from pure proteins, we can determine amino acid sequences and investigate biochemical functions. From the amino acid sequences, we can map evolutionary relationships between proteins in diverse organisms (Chapter 6). By using crystals grown from pure protein, we can obtain x-
67
The assay: How do we recognize the protein that we are looking for?
Purification should yield a sample containing only one type of molecule—
A protein can be purified by subjecting the impure mixture of the starting material to a series of separations based on physical properties such as size and charge. To monitor the success of this purification, the biochemist needs a test, called an assay, for some unique identifying property of the protein. A positive result on the assay indicates that the protein is present. Although assay development can be a challenging task, the more specific the assay, the more effective the purification. For enzymes, which are protein catalysts (Chapter 8), the assay usually measures enzyme activity—that is, the ability of the enzyme to promote a particular chemical reaction. This activity is often measured indirectly. Consider the enzyme lactate dehydrogenase, which catalyzes the following reaction in the synthesis of glucose:
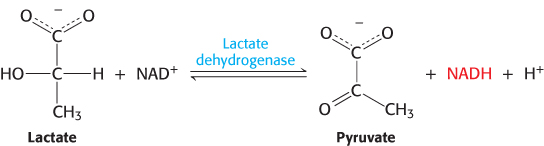
Reduced nicotinamide adenine dinucleotide (NADH, Figure 15.13) absorbs light at 340 nm, whereas oxidized nicotinamide adenine dinucleotide (NAD+) does not. Consequently, we can follow the progress of the reaction by examining how much light-
To analyze how our purification scheme is working, we need one additional piece of information—
Proteins must be released from the cell to be purified
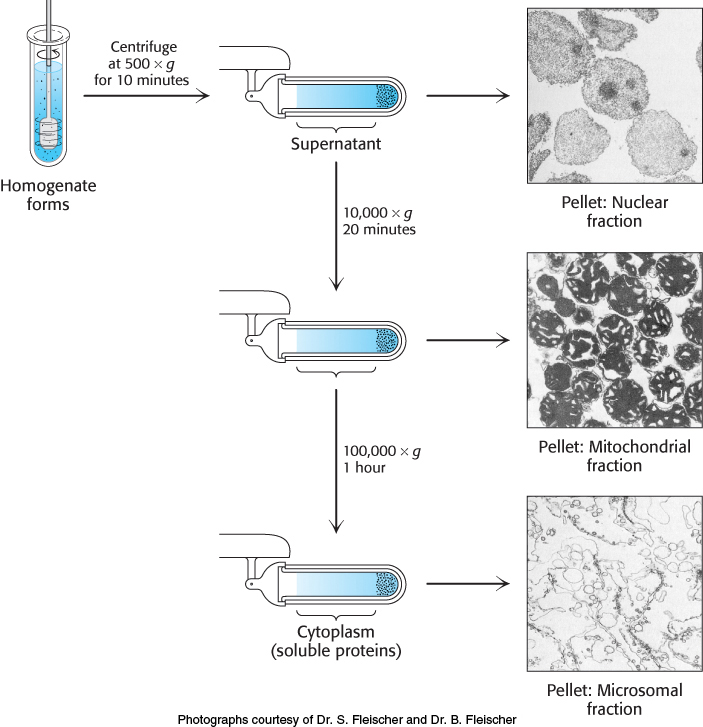
Having found an assay and chosen a source of protein, we now fractionate the cell into components and determine which component is enriched in the protein of interest. In the first step, a homogenate is formed by disrupting the cell membrane, and the mixture is fractionated by centrifugation, yielding a dense pellet of heavy material at the bottom of the centrifuge tube and a lighter supernatant above (Figure 3.1). The supernatant is again centrifuged at a greater force to yield yet another pellet and supernatant. This procedure, called differential centrifugation, yields several fractions of decreasing density, each still containing hundreds of different proteins. The fractions are each separately assayed for the desired activity. Usually, one fraction will be enriched for such activity, and it then serves as the source of material to which more-
68
Proteins can be purified according to solubility, size, charge, and binding affinity
Several thousand proteins have been purified in active form on the basis of such characteristics as solubility, size, charge, and specific binding affinity. Usually, protein mixtures are subjected to a series of separations, each based on a different property. At each step in the purification, the preparation is assayed and its specific activity is determined. A variety of purification techniques are available.
Salting out.
Most proteins are less soluble at high salt concentrations, an effect called salting out. The salt concentration at which a protein precipitates differs from one protein to another. Hence, salting out can be used to fractionate proteins. For example, 0.8 M ammonium sulfate precipitates fibrinogen, a blood-
69
Dialysis.
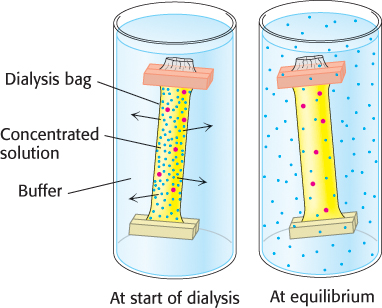
Proteins can be separated from small molecules such as salt by dialysis through a semipermeable membrane, such as a cellulose membrane with pores (Figure 3.2). The protein mixture is placed inside the dialysis bag, which is then submerged in a buffer solution that is devoid of the small molecules to be separated away. Molecules having dimensions significantly greater than the pore diameter are retained inside the dialysis bag. Smaller molecules and ions capable of passing through the pores of the membrane diffuse down their concentration gradients and emerge in the solution outside the bag. This technique is useful for removing a salt or other small molecule from a cell fractionate, but it will not distinguish between proteins effectively.
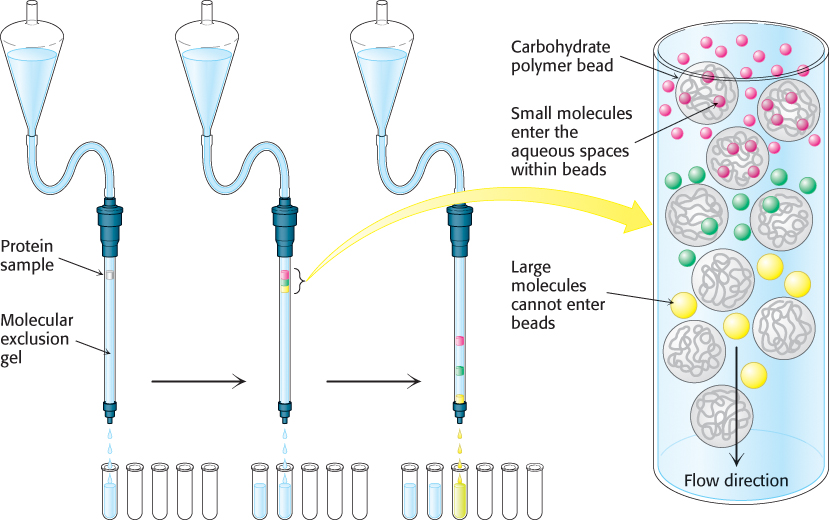
Gel-filtration chromatography.
More-
Ion-exchange chromatography.
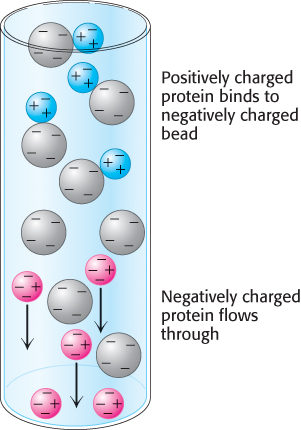
70
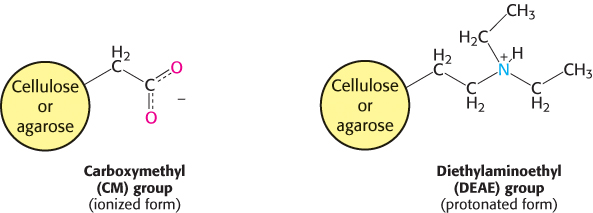
To obtain a protein of high purity, one chromatography step is usually not sufficient, because other proteins in the crude mixture will likely co-
Affinity chromatography.
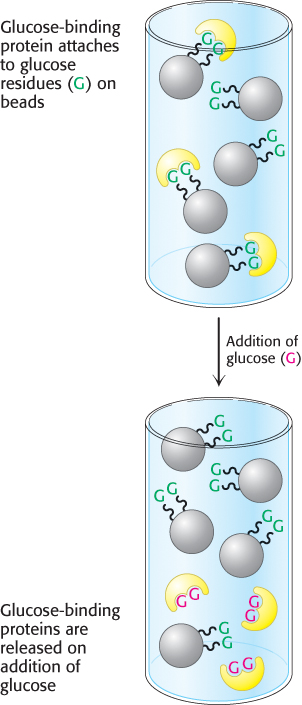
Affinity chromatography is another powerful means of purifying proteins that is highly selective for the protein of interest. This technique takes advantage of the high affinity of many proteins for specific chemical groups. For example, the plant protein concanavalin A is a carbohydrate-
In general, affinity chromatography can be effectively used to isolate a protein that recognizes group X by (1) covalently attaching X or a derivative of it to a column; (2) adding a mixture of proteins to this column, which is then washed with buffer to remove unbound proteins; and (3) eluting the desired protein by adding a high concentration of a soluble form of X or altering the conditions to decrease binding affinity. Affinity chromatography is most effective when the interaction of the protein and the molecule that is used as the bait is highly specific.
Affinity chromatography can be used to isolate proteins expressed from cloned genes (Section 5.2). Extra amino acids are encoded in the cloned gene that, when expressed, serve as an affinity tag that can be readily trapped. For example, repeats of the codon for histidine may be added such that the expressed protein has a string of histidine residues (called a His tag) on one end. The tagged proteins are then passed through a column of beads containing covalently attached, immobilized nickel(II) or other metal ions. The His tags bind tightly to the immobilized metal ions, binding the desired protein, while other proteins flow through the column. The protein can then be eluted from the column by the addition of imidazole or some other chemical that binds to the metal ions and displaces the protein.
71
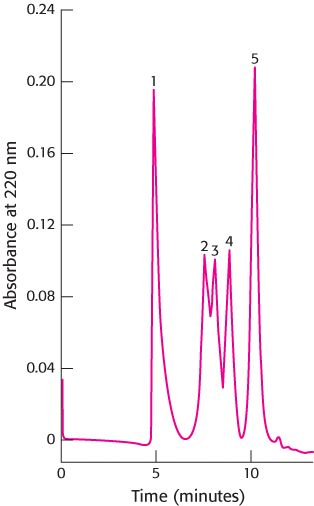
High-performance liquid chromatography.
A technique called high-
Proteins can be separated by gel electrophoresis and displayed
How can we tell that a purification scheme is effective? One way is to ascertain that the specific activity rises with each purification step. Another is to determine that the number of different proteins in each sample declines at each step. The technique of electrophoresis makes the latter method possible.
Gel electrophoresis.
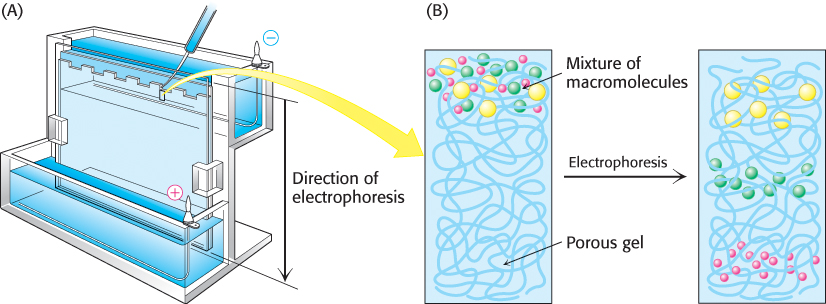
A molecule with a net charge will move in an electric field. This phenomenon, termed electrophoresis, offers a powerful means of separating proteins and other macromolecules, such as DNA and RNA. The velocity of migration (v) of a protein (or any molecule) in an electric field depends on the electric field strength (E), the net charge on the protein (z), and the frictional coefficient (f).

The electric force Ez driving the charged molecule toward the oppositely charged electrode is opposed by the viscous drag fv arising from friction between the moving molecule and the medium. The frictional coefficient f depends on both the mass and shape of the migrating molecule and the viscosity (η) of the medium. For a sphere of radius r,

Electrophoretic separations are nearly always carried out in porous gels (or on solid supports such as paper) because the gel serves as a molecular sieve that enhances separation (Figure 3.7). Molecules that are small compared with the pores in the gel readily move through the gel, whereas molecules much larger than the pores are almost immobile. Intermediate-
72
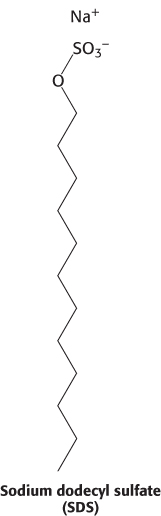
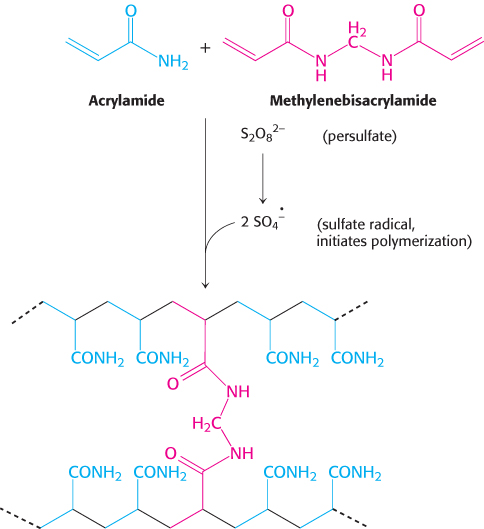
Proteins can be separated largely on the basis of mass by electrophoresis in a polyacrylamide gel under denaturing conditions. The mixture of proteins is first dissolved in a solution of sodium dodecyl sulfate (SDS), an anionic detergent that disrupts nearly all noncovalent interactions in native proteins. β-Mercaptoethanol (2-
73
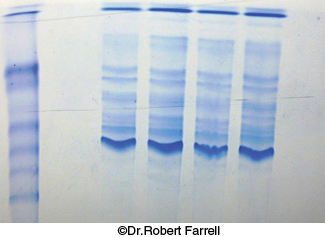
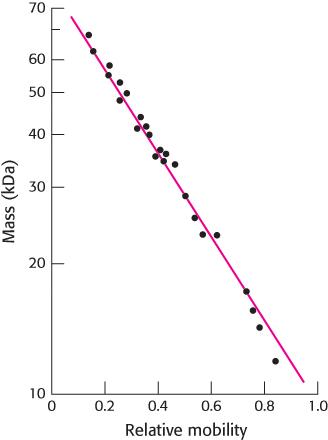
Small proteins move rapidly through the gel, whereas large proteins stay at the top, near the point of application of the mixture. The mobility of most polypeptide chains under these conditions is linearly proportional to the logarithm of their mass (Figure 3.10). Some carbohydrate-
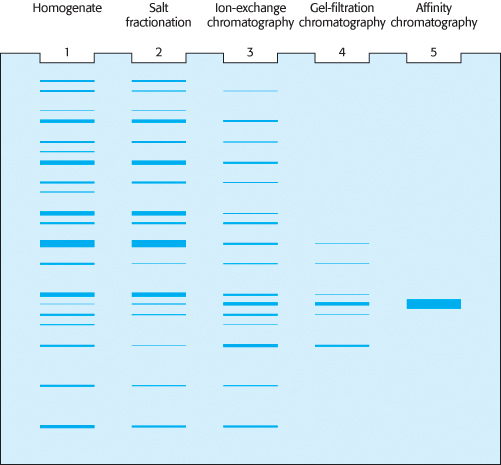
We can examine the efficacy of our purification scheme by analyzing a part of each fraction by electrophoresis. The initial fractions will display dozens to hundreds of proteins. As the purification progresses, the number of bands will diminish, and the prominence of one of the bands should increase. This band should correspond to the protein of interest.
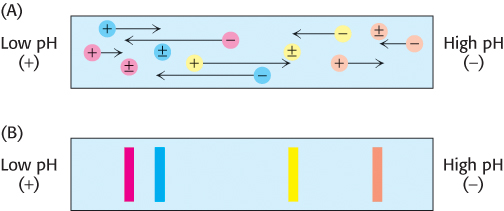
Isoelectric focusing.
Proteins can also be separated electrophoretically on the basis of their relative contents of acidic and basic residues. The isoelectric point (pI) of a protein is the pH at which its net charge is zero. At this pH, its electrophoretic mobility is zero because z in equation 1 is equal to zero. For example, the pI of cytochrome c, a highly basic electron-
74
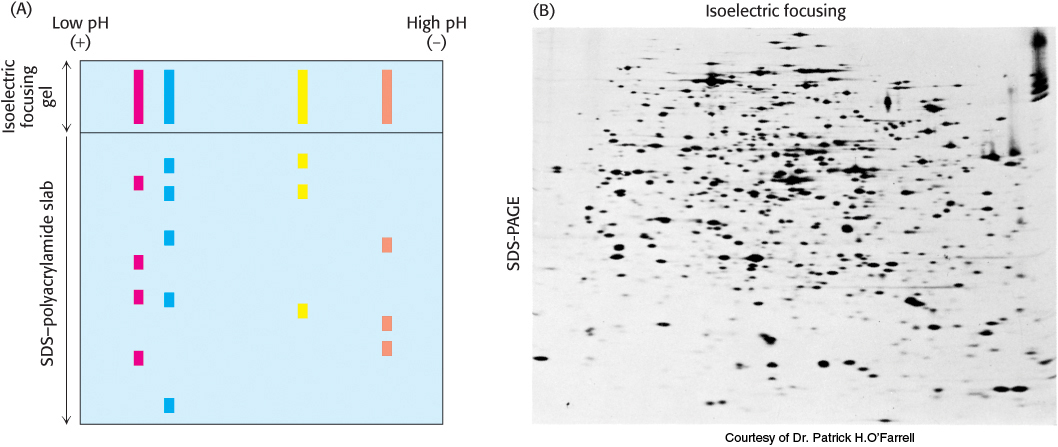
Two-dimensional electrophoresis.
Isoelectric focusing can be combined with SDS-
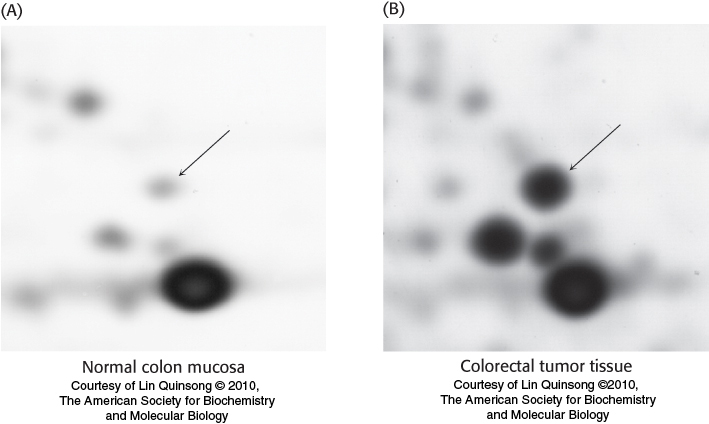
Proteins isolated from cells under different physiological conditions can be subjected to two-
75
A protein purification scheme can be quantitatively evaluated
To determine the success of a protein purification scheme, we monitor each step of the procedure by determining the specific activity of the protein mixture and by subjecting it to SDS-
|
Step |
Total protein (mg) |
Total activity (units) |
Specific activity (units mg−1) |
Yield (%) |
Purification level |
|---|---|---|---|---|---|
|
Homogenization |
15,000 |
150,000 |
10 |
100 |
1 |
|
Salt fractionation |
4,600 |
138,000 |
30 |
92 |
3 |
|
Ion- |
1,278 |
115,500 |
90 |
77 |
9 |
|
Gel- |
68.8 |
75,000 |
1,100 |
50 |
110 |
|
Affinity chromatography |
1.75 |
52,500 |
30,000 |
35 |
3,000 |
Total Protein. The quantity of protein present in a fraction is obtained by determining the protein concentration of a part of each fraction and multiplying by the fraction’s total volume.
Total Activity. The enzyme activity for the fraction is obtained by measuring the enzyme activity in the volume of fraction used in the assay and multiplying by the fraction’s total volume.
Specific Activity. This parameter is obtained by dividing total activity by total protein.
Yield. This parameter is a measure of the activity retained after each purification step as a percentage of the activity in the crude extract. The amount of activity in the initial extract is taken to be 100%.
Purification Level. This parameter is a measure of the increase in purity and is obtained by dividing the specific activity, calculated after each purification step, by the specific activity of the initial extract.
As we see in Table 3.1, the first purification step, salt fractionation, leads to an increase in purity of only 3-
76
A good purification scheme takes into account both purification levels and yield. A high degree of purification and a poor yield leave little protein with which to experiment. A high yield with low purification leaves many contaminants (proteins other than the one of interest) in the fraction and complicates the interpretation of subsequent experiments.
Ultracentrifugation is valuable for separating biomolecules and determining their masses
We have already seen that centrifugation is a powerful and generally applicable method for separating a crude mixture of cell components. This technique is also valuable for the analysis of the physical properties of biomolecules. Using centrifugation, we can determine such parameters as mass and density, learn about the shape of a molecule, and investigate the interactions between molecules. To deduce these properties from the centrifugation data, we require a mathematical description of how a particle behaves when a centrifugal force is applied.
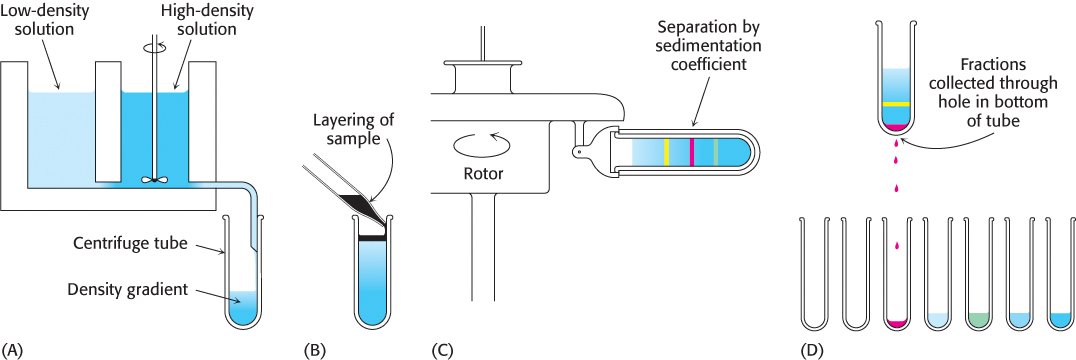
A particle will move through a liquid medium when subjected to a centrifugal force. A convenient means of quantifying the rate of movement is to calculate the sedimentation coefficient, s, of a particle by using the following equation:
where m is the mass of the particle,  is the partial specific volume (the reciprocal of the particle density), ρ is the density of the medium, and f is the frictional coefficient (a measure of the shape of the particle). The
  term is the buoyant force exerted by liquid medium.
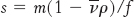
Sedimentation coefficients are usually expressed in Svedberg units (S), equal to 10−13 s. The smaller the S value, the more slowly a molecule moves in a centrifugal field. The S values for a number of biomolecules and cellular components are listed in Table 3.2 and Figure 3.15.
|
Protein |
S value (Svedberg units) |
Molecular weight |
|---|---|---|
|
Pancreatic trypsin inhibitor |
1 |
6,520 |
|
Cytochrome c |
1.83 |
12,310 |
|
Ribonuclease A |
1.78 |
13,690 |
|
Myoglobin |
1.97 |
17,800 |
|
Trypsin |
2.5 |
23,200 |
|
Carbonic anhydrase |
3.23 |
28,800 |
|
Concanavalin A |
3.8 |
51,260 |
|
Malate dehydrogenase |
5.76 |
74,900 |
|
Lactate dehydrogenase |
7.54 |
146,200 |
|
Source: T. Creighton, Proteins, 2d ed. (W. H. Freeman and Company, 1993), Table 7.1. |
||
Several important conclusions can be drawn from the preceding equation:
1. The sedimentation velocity of a particle depends in part on its mass. A more massive particle sediments more rapidly than does a less massive particle of the same shape and density.
2. Shape, too, influences the sedimentation velocity because it affects the viscous drag. The frictional coefficient f of a compact particle is smaller than that of an extended particle of the same mass. Hence, elongated particles sediment more slowly than do spherical ones of the same mass.
77
3. A dense particle moves more rapidly than does a less dense one because the opposing buoyant force  is smaller for the denser particle.
4. The sedimentation velocity also depends on the density of the solution (ρ). Particles sink when  , float when
  , and do not move when
  .
.
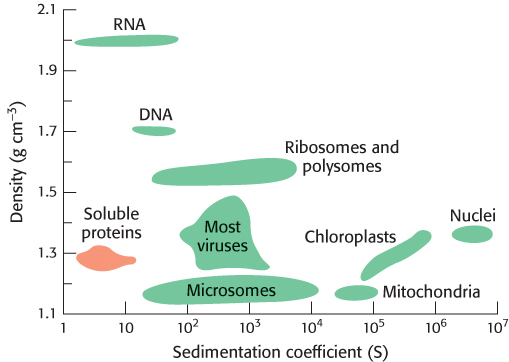
A technique called zonal, band, or most commonly gradient centrifugation can be used to separate proteins with different sedimentation coefficients. The first step is to form a density gradient in a centrifuge tube. Differing proportions of a low-
78
The mass of a protein can be directly determined by sedimentation equilibrium, in which a sample is centrifuged at low speed such that a concentration gradient of the sample is formed. However, this sedimentation is counterbalanced by the diffusion of the sample from regions of high to low concentration. When equilibrium has been achieved, the shape of the final gradient depends solely on the mass of the sample. The sedimentation-
Protein purification can be made easier with the use of recombinant DNA technology
In Chapter 5, we shall consider the widespread effect of recombinant DNA technology on all areas of biochemistry and molecular biology. The application of recombinant methods to the overproduction of proteins has enabled dramatic advances in our understanding of their structure and function. Before the advent of this technology, proteins were isolated solely from their native sources, often requiring a large amount of tissue to obtain a sufficient amount of protein for analytical study. For example, the purification of bovine deoxyribonuclease in 1946 required nearly ten pounds of beef pancreas to yield one gram of protein. As a result, biochemical studies on purified material were often limited to abundant proteins.
Armed with the tools of recombinant technology, the biochemist is now able to enjoy a number of significant advantages:
1. Proteins can be expressed in large quantities. The homogenate serves as the starting point in a protein purification scheme. For recombinant systems, a host organism that is amenable to genetic manipulation, such as the bacterium Escherichia coli or the yeast Pichia pastoris, is utilized to express a protein of interest. The biochemist can exploit the short doubling times and ease of genetic manipulation of such organisms to produce large amounts of protein from manageable amounts of culture. As a result, purification can begin with a homogenate that is often highly enriched with the desired molecule. Moreover, a protein can be easily obtained regardless of its natural abundance or its species of origin.
2. Affinity tags can be fused to proteins. As described above, affinity chromatography can be a highly selective step within a protein purification scheme. Recombinant DNA technology enables the attachment of any one of a number of possible affinity tags to a protein (such as the “His tag” mentioned earlier). Hence, the benefits of affinity chromatography can be realized even for those proteins for which a binding partner is unknown or not easily determined.
3. Proteins with modified primary structures can be readily generated. A powerful aspect of recombinant DNA technology as applied to protein purification is the ability to manipulate genes to generate variants of a native protein sequence (Section 5.2). We learned in Section 2.4 that many proteins consist of compact domains connected by flexible linker regions. With the use of genetic-
79