Amino Acids Are Categorized by Chemical Properties
All amino acids have a central carbon atom, designated Cα (the α carbon), which is bonded to a hydrogen, an amino group, a carboxyl group, and a side chain called an R group (Figure 4-2). The R group distinguishes one amino acid from another and ranges from a simple hydrogen atom (in glycine) to relatively complex arrangements of carbon, hydrogen, nitrogen, oxygen, and sulfur. Side chains can be assorted into four groups according to their polarity and charge. The 20 most common amino acids found in proteins are shown in Figure 4-3 and Table 4-1.
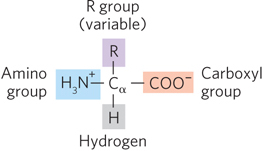
Figure 4-2: The general structure of an amino acid. The R group, or side chain, attached to the α carbon (the central carbon as shown here) is different in each amino acid. The name “amino acid” derives from the presence of both an amino group and a carboxylic acid group on the α carbon.
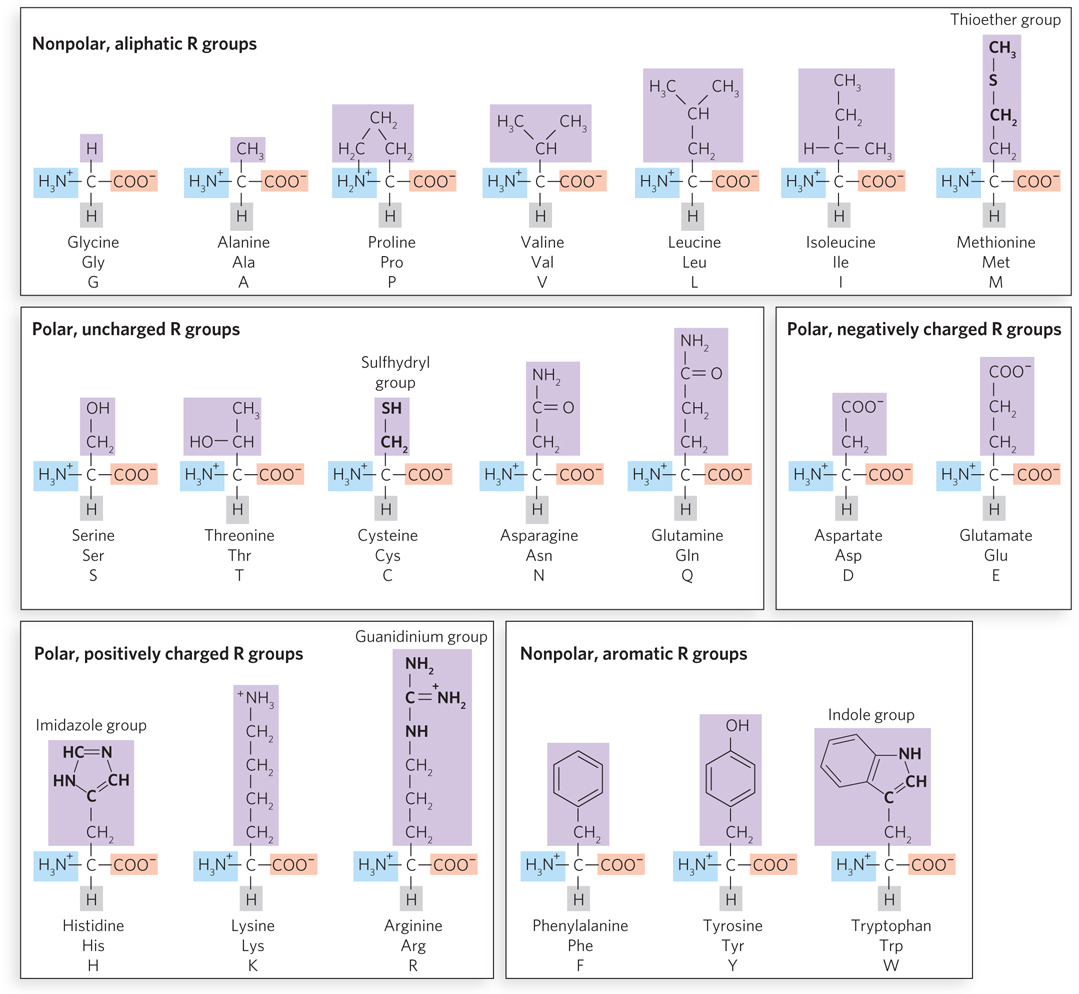
Figure 4-3: The 20 common amino acids. The structural formula for each amino acid shows its ionization state at pH 7.0. The groups attached to the α-carbon atom that are shaded pink, blue, or gray—the carboxyl group, amino group, and single proton, respectively—are common to all the amino acids. The side chains (R groups), which are unique to each amino acid, are shaded purple. The R group of histidine is drawn as uncharged, but its pKa is such that a significant fraction of the His side chains will be protonated and thus positively charged at pH 7.0. Several important functional groups in some amino acid side chains are highlighted.
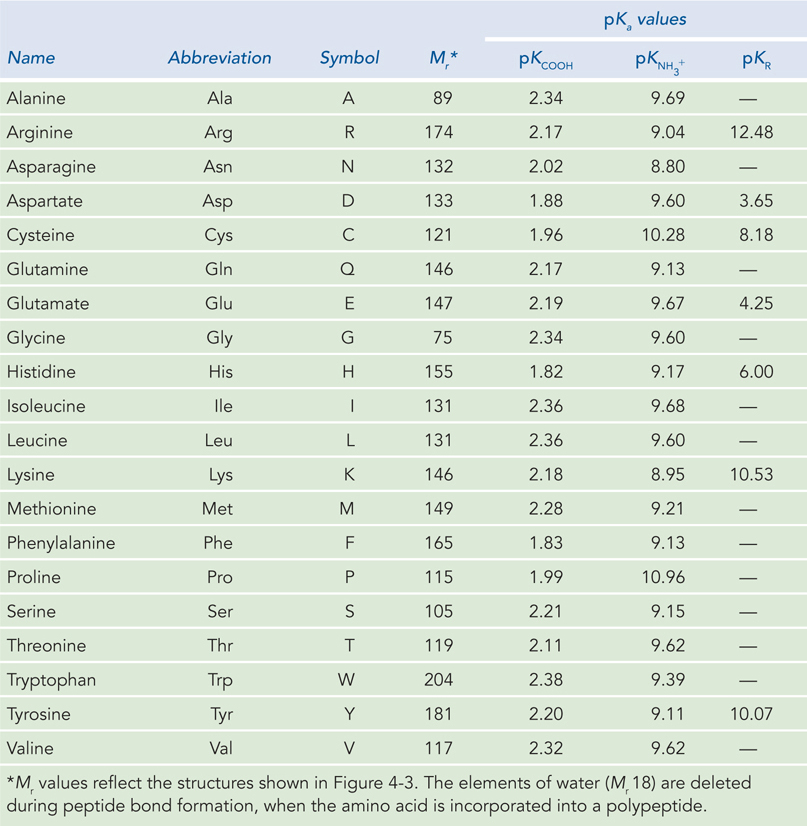
Figure 4-1: The 20 Common Amino Acids
Sometimes, other, much less common amino acids are also found in protein sequences. For example, selenocysteine contains a selenium atom in place of the sulfur atom of cysteine and is inserted into proteins by an unusual mechanism. Selenocysteine is an essential amino acid for humans, although it is known to occur in only 25 of the thousands of proteins encoded by the human genome.
Amino acids are often abbreviated using a three-letter name or a one-letter symbol. Some amino acids have an R group that is ionizable, which may give it a positive charge when protonated and a neutral charge when unprotonated, or a neutral charge when protonated and a negative charge when unprotonated. When the pKa of the side-chain R group is lower than the pH of its surroundings, the group will be unprotonated (see Section 3.5 for an explanation of pKa). The overall charge of a protein is mostly due to side-chain groups, because the amino and carboxyl groups are involved in peptide bonds—except for those of the N-terminal and C-terminal amino acid residues, respectively, of the polypeptide chain.
Nonpolar, Aliphatic R Groups Aliphatic side chains are those composed only of hydrocarbon chains (–CH2–), which are nonpolar and quite hydrophobic. Methionine, with a nonpolar thioether group (R–S–CH3), is also included here. These residues tend to cluster inside proteins and stabilize the structure through hydrophobic effects. Glycine is also nonpolar, but having only a single hydrogen atom as its side chain, it contributes little to hydrophobic effects. Proline has an aliphatic side chain, too, and its rigid cyclic structure constrains and limits its possible conformations.
Polar, Uncharged R Groups Polar, uncharged R groups can interact extensively with water, or with atoms in other side chains, through hydrogen bonds. Recall from Chapter 3 that hydrogen bonds are interactions between a donor hydrogen atom that is covalently bonded to an electronegative atom and an acceptor atom that usually has a lone pair of electrons. Examples of donor groups are the hydroxyl groups of serine and threonine and the sulfhydryl group (R–S–H) of cysteine. Asparagine and glutamine contain an amide group that can act as donor or acceptor. Two Cys residues brought in close proximity may be oxidized to form a disulfide bond (see the How We Know section at the end of this chapter).
Polar, Charged R Groups Three amino acids carry a positive charge at pH 7.0 (i.e., they are basic). Lysine contains a side-chain amino group, arginine has a guanidinium group, and histidine contains an imidazole group (see Figure 4-3). The side chains of two amino acids, aspartate and glutamate, contain a carboxyl group and therefore carry a negative charge at pH 7.0 (i.e., they are acidic). Charged side chains can form hydrogen bonds and can form ionic interactions with amino acids of opposite charge.
Nonpolar, Aromatic R Groups Phenylalanine, tyrosine, and tryptophan contain aromatic side chains and therefore are hydrophobic. Phenylalanine is the most hydrophobic among them, whereas the tyrosine hydroxyl group and the tryptophan nitrogen can form hydrogen bonds and thus impart some polarity to these residues.
Amino Acids Are Connected in a Polypeptide Chain
The covalent link between two adjacent amino acids is called a peptide bond, and the result of many such linkages is known as a polypeptide chain. The peptide bond is formed by condensation of the α-carbon carboxyl group of one amino acid with the α-carbon amino group of another. Therefore, the linear sequence of a polypeptide chain has an amino terminus, or N-terminus, and a carboxyl terminus, or C-terminus.
KEY CONVENTION
When an amino acid sequence is given, it is written and read from the N-terminus to the C-terminus, left to right.
The Cα atoms of two adjacent amino acids in a polypeptide chain are separated by three covalent bonds: Cα–C–N–Cα. The C–N connection is the peptide bond that joins two amino acids, but these four atoms constitute the covalent bonds that connect all the residues of a polypeptide chain and thus make up the polypeptide “backbone.” Single bonds between atoms typically allow free rotation, but not so for the peptide bond. Linus Pauling and Robert Corey’s analysis of dipeptides and tripeptides by x-ray crystallography revealed that the four atoms of the peptide backbone lie in the same plane. Another key observation was that the peptide C–N bond length (1.32 Å; 1 Å (angstrom) is 1 × 10⁻¹⁰ m) is significantly shorter than a single C–N bond (1.49 Å) and approaches the length of a C=N double bond (1.27 Å). These observations are explained by resonance, the sharing of electrons between the carboxyl oxygen and amide nitrogen, creating partial double bonds (Figure 4-4a; also see the How We Know section in Chapter 3).
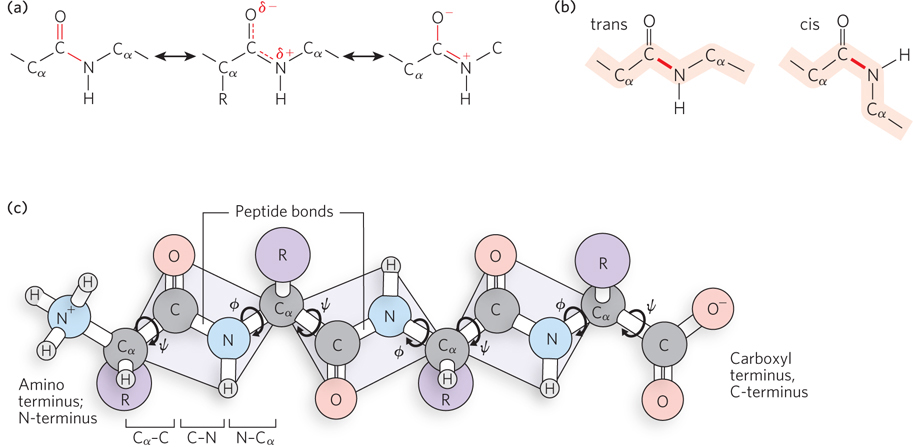
Figure 4-4: Peptide backbone atoms. (a) Resonance of the peptide bond gives it a partial double-bond character. (b) The cis and trans isomers of a peptide bond. The bonds in most proteins are trans. The peptide backbone is shaded in orange and the peptide bond is in red. (c) The three bonds that separate sequential a carbons in a polypeptide chain lie in a plane. The N–Cα and Cα–C bonds can rotate, with torsion angles designated φ and ψ.
Atoms are not free to rotate about a double bond. A partial double bond gives rise to two possible configurations, referred to as the cis and trans isomers. In peptide bonds, the trans isomer is favored about 1,000:1 over the cis isomer. The trans isomer of a peptide bond is one in which the two Cα atoms of adjacent amino acids lie on opposite sides of the peptide bond, as do the carbonyl oxygen and the amide hydrogen (Figure 4-4b). The double-bond character of the peptide bond explains why the atoms in a peptide bond lie in the same plane. Therefore, a chain of amino acid residues can be envisioned as a series of connected planes (Figure 4-4c). The Cα–C and N–Cα bonds are free to rotate. However, in a polypeptide, the angles between these bonds are constrained. These angles are referred to as torsion angles (or dihedral angles): φ (phi) for the N–Cα bond and ψ (psi) for the Cα–C bond.
KEY CONVENTION
Rotation around a double-bonded pair of atoms is restricted, placing the other atoms that adjoin them in one plane. Two atoms or groups adjoining the double-bonded atoms can lie either in cis (Latin for “same side”) or in trans (“other side”). The two forms are isomers because there is no difference between them other than their configuration. The amide hydrogen and carbonyl oxygen can be used to specify the cis and trans isomers of the peptide bond, as can the Cα atoms of adjacent amino acid residues. For example, in the trans isomer, the Cα atoms of adjacent amino acids lie on opposite sides of the peptide bond that joins them.
In reality, however, rotational movements are restricted, because the size of a bulky side chain may preclude a close approach to nearby atoms in the polypeptide backbone. This “steric clash” between an amino acid side chain and neighboring atoms limits φ and ψ and thus the permissible orientations of one peptide-bond plane relative to another. G. N. Ramachandran developed a way to represent graphically the allowed values of φ and ψ for each amino acid. The Ramachandran plot for alanine is shown in Figure 4-5. The plots for most other amino acids look quite similar, with two exceptions. Glycine has a broader range of allowed angles, because its side chain is a single hydrogen atom and therefore very small. In contrast, proline, with its side chain in a cyclic structure that is covalently bonded to the α-amino group, is greatly restricted in its allowed range of conformations. Conformations deemed possible are those that involve little or no interference between atoms, based on known van der Waals radii and bond angles.
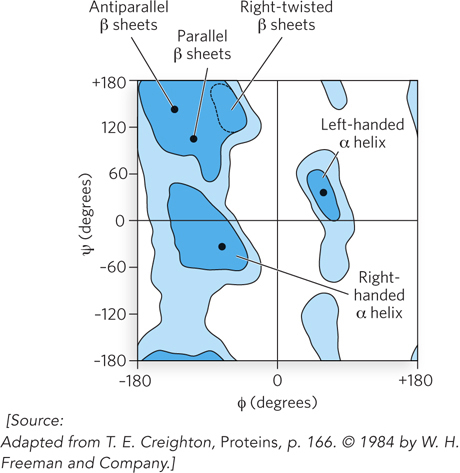
Figure 4-5: A Ramachandran plot: torsion angles between amino acids. The conformations of peptides are defined by the values of ψ and φ for each amino acid residue. Allowable conformations are those that involve little or no steric hindrance between atoms of the amino acid side chain and nearby atoms of the peptide backbone. Shown here is the Ramachandran plot for Ala residues. Easily allowed conformations are in dark blue; medium blue signifies bond conformations that approach unfavorable values; light blue, conformations that are allowed if some flexibility is permitted in the torsion angles. Unshaded regions indicate conformations that are not allowed. With the exception of Gly and Pro residues, the plots for all other amino acid residues are very similar to this plot for alanine. The range of allowed φ and ψ values is characteristic for each type of secondary structure, as shown. Secondary structural elements are discussed in Section 4.2.
Evolutionary Relationships Can Be Determined from Primary Sequence Comparisons
As organisms evolve and diverge to form different species, their genetic material remains almost the same at first, but differs increasingly as time passes. For this reason, the amino acid sequences of proteins can be used to explore evolution. The premise is simple. If two organisms are closely related, the primary sequence of the same protein in two different organisms should be similar, but the sequences will diverge as the evolutionary distance between the organisms–that is, the time since they arose from a common ancestor–increases. The wealth of whole-genome sequences now available, from bacteria to humans, can be used to trace evolutionary lineages.
Amino acid substitutions occurring through mutations do not appear at random, and this opens up any analysis to interpretation. Some proteins have more amino acid variation among species than others, indicating that proteins evolve at different rates. At some positions in the primary structure, the need to maintain protein function limits amino acid substitutions to a few that can be tolerated. In other words, amino acid residues essential for the protein’s activities are conserved over evolutionary time. Residues that are less important to function vary more over time and among species, and these residues provide the information needed to trace evolution.
Protein sequences are superior to DNA sequences for exploring evolutionary relationships. DNA has only four different nucleotide building blocks, and a purely random alignment of unrelated sequences would produce matches at about 25% of the nucleotides in the alignment. In contrast, the 20 common amino acids used in proteins greatly lower the probability of such chance, uninformative alignments. An example of how protein sequences can be used to trace evolutionary origins is presented in the How We Know section at the end of this chapter. Genomics, proteomics, and the use of sequences to study the molecular evolution of cells are discussed in detail in Chapter 8.
Before moving on, we should note that many of the protein analyses used to determine the information presented in this chapter require that the protein be purified—completely separated from all the other proteins in the cell. Protein purification typically takes several fractionation steps. Particularly powerful techniques used to purify and analyze proteins include column chromatography and polyacrylamide gel electrophoresis, as summarized in Highlight 4-1.
SECTION 4.1 SUMMARY
The primary structure of a protein is its sequence of amino acids, along with any disulfide linkages between cysteine residues.
An amino acid consists of an amino group and a carboxyl group with a central carbon atom (Cα) between them. Also connected to Cα are a side chain (R group) and a hydrogen atom.
There are 20 common amino acids, with characteristic side chains that differ in their chemical properties. Side chains can be charged or uncharged, polar or nonpolar, aliphatic or aromatic.
Amino acid residues in a protein are linked by peptide bonds. The atoms of a peptide bond and the a carbons connected to them lie in one plane, due to the partial double bond between the carbonyl and amide groups, giving rise to cis and trans isomers. The trans isomer of the peptide bond is the most common in proteins.
The planar configuration of the peptide bond limits how close the R groups of adjoining amino acids can approach one another. This leads to preferred, or allowed, torsion angles of the single bonds that connect the Cα atom to the carbonyl carbon (Cα–C) and the amide nitrogen (N–Cα): angles ψ (psi) and φ (phi), respectively.
Protein sequences reveal evolutionary relationships among species. The more similar the primary sequence of the same protein between two species, the more recently the species diverged from a common ancestor.
HIGHLIGHT 4-1 A CLOSER LOOK: Purification of Proteins by Column Chromatography and SDS-PAGE
To study the structure of a protein, the researcher must first purify it from all other proteins in the cell. First, cells are lysed and particulate matter, such as cell wall debris and insoluble protein, is removed by centrifugation to yield a “crude extract.” The crude extract, containing soluble proteins, is then fractionated to separate the proteins and isolate the one that is of particular interest.
There are many ways to separate proteins. One method is chromatography, and one of the most powerful chromatographic techniques is column chromatography. In this technique, a protein mixture is applied to a column containing a resin, or matrix, that interacts differently with the various proteins (Figure 1). After the protein solution is applied to the top of the column, a buffer is passed through the column to thoroughly wash away any proteins that do not bind to the matrix. Then another buffer is applied that causes bound proteins to dissociate from the matrix; the proteins are carried out in the buffer flow, a process referred to as “elution” of proteins from the column. The proteins come off the column at different times, depending on how they interact with the resin. The column matrix and “elution buffer” are carefully chosen so that different proteins dissociate from the matrix at different times. The eluted proteins are collected in a fraction collector, which gradually moves test tubes under the column, thus keeping the proteins that elute at different times separate from one another.
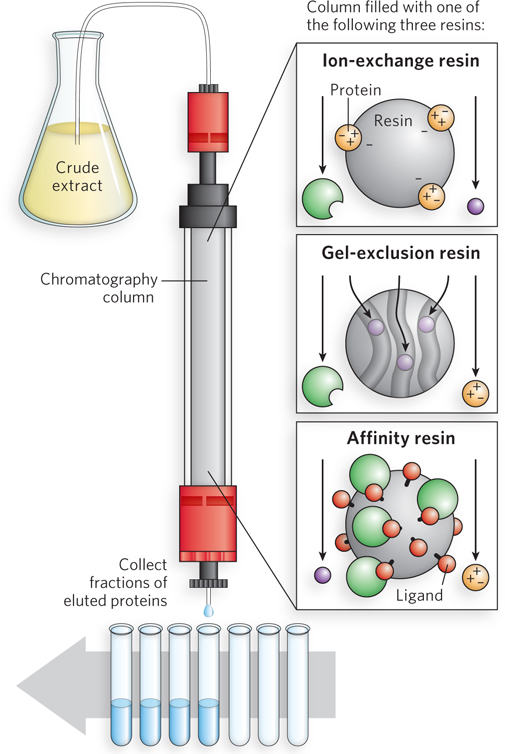
FIGURE 1 Column chromatography is performed in a glass or plastic tube containing one type of fractionating resin (matrix). The protein mixture is applied to the top of the column, and as buffer flows through, different proteins bind to the matrix according to the properties selected by the particular resin. These properties are typically the size or charge of the protein or the specific ligand to which the protein binds. Proteins are then dissociated from the matrix by eluting with a buffer that releases them at different times, and the proteins are collected in separate fractions.
Several types of resin can be used in column chromatography, which separate proteins based on different properties. In ion-exchange chromatography, proteins are separated by charge. The resin contains either cation groups (in a process called anion exchange) or anion groups (in cation exchange). Proteins are usually eluted from the column with an increasing concentration of salt solution, and their release depends on the nature of charged amino acid residues on their surface. In gel-exclusion chromatography, proteins are separated by size. The resin is composed of hollow beads with pores of a particular size; large proteins move around the beads and so elute earlier than smaller proteins that can enter the resin pores and thus take a longer path through the column. In affinity chromatography, proteins are sorted by the type of ligand they bind. A selected ligand is covalently coupled to the column resin, and the protein mixture is applied. Elution can be performed with a salt solution but is often done with a solution of the ligand itself, which binds to the active site of the protein, releasing it from the resin-bound ligand. Because ligand binding can be very specific to a protein, this technique is often highly selective for the protein of interest.
After column chromatography, the fractions are analyzed for the protein of interest; for example, if the protein is catalytic, its presence in fractions can be analyzed by an assay that measures that particular protein activity. Next, proteins in the fractions obtained at various stages of the purification process can be visualized by sodium dodecyl sulfate–polyacrylamide gel electrophoresis (SDS-PAGE) (Figure 2a). The process begins with the preparation of a polyacrylamide gel. A solution of acrylamide and bis-acrylamide is prepared, then ammonium persulfate is added, which supplies free radicals that initiate polymerization of the acrylamide. The bis-acrylamide cross-links the polyacrylamide to form a matrix. The cross-linked gel acts like a sieve to sort proteins by size. A typical polyacrylamide gel contains around 6% to 10% acrylamide, but different percentages can be used; “high percent” gels resolve small proteins better than “low percent” gels. Before the acrylamide mixture polymerizes, SDS is added and the solution is poured between two glass plates, and wells (which will later hold the protein samples) are created by inserting a comb, or mold. The protein samples are treated with SDS, a negatively charged detergent that binds proteins and denatures them, giving all proteins in the sample a similar shape. Because the amount of SDS binding to a protein is usually related to protein size, SDS also gives all proteins a similar charge-to-mass ratio. The treated samples are loaded into the wells at the top of the gel (which also contains SDS), and an electric field is applied to the gel, which pulls the charged proteins through the matrix. The proteins migrate through the gel at different rates according to their relative molecular mass, with smaller proteins migrating faster than larger ones. Larger proteins migrate more slowly because they cannot weave through the matrix as quickly as smaller proteins.
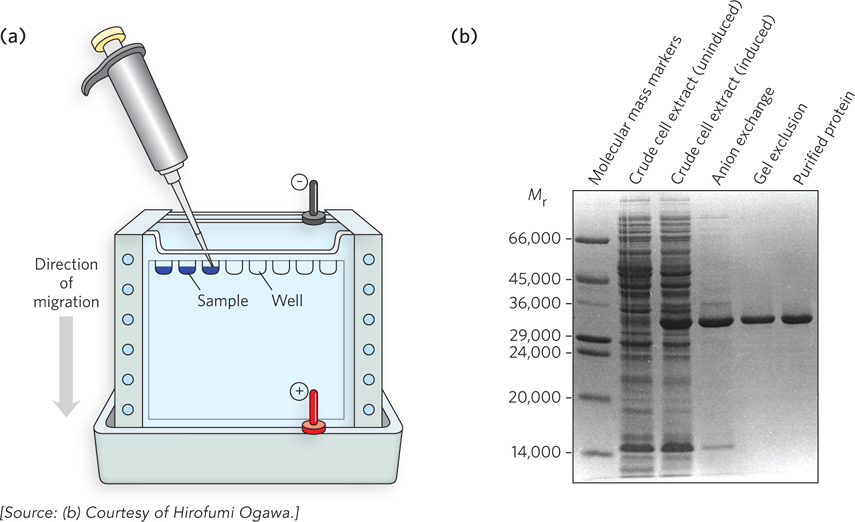
FIGURE 2 (a) In SDS-PAGE, the cross-linked gel is contained in a device to which an electric current can be applied, such that the proteins migrate through the gel matrix. (b) A Coomassie Blue–stained SDS-PAGE gel, tracking the gradual purification of glycine N-methyltransferase. The “induced” cell extract sample is from cells that were induced to produce the protein, while the “uninduced” sample is from cells prior to inducing the protein. In practice, the protein bands are stained blue, but in publications the image is almost always shown in black and white.
After the proteins have been separated within the gel, the gel is removed from the glass “sandwich” and soaked in an acidic buffer to precipitate (or fix) the proteins, which prevents their diffusing out of the gel. The gel is then treated with a dye that selectively binds to proteins. A common dye for this purpose is Coomassie Blue. Figure 2b shows a Coomassie Blue–stained SDS-PAGE gel containing protein samples taken at different stages of a protein purification. The rightmost lane in the gel shows only the subunits of the pure protein, the enzyme glycine N-methyltransferase; samples taken earlier in the purification procedure show additional proteins. Proteins of known molecular mass are typically applied to one lane of the gel to serve as “molecular mass markers” (as in the leftmost lane in Figure 2b), which allows the researcher to estimate the mass of other proteins in the gel. Electrophoresis is an invaluable technique for molecular biologists, and we’ll encounter many variations of it throughout this book.


