Section 12.2 Exercises
CLARIFYING THE CONCEPTS
Question 12.57
1. Explain why we cannot conclude, based on the ANOVA results alone, that one particular population mean differs from another. (p. 686)
12.2.1
ANOVA only tests for whether or not all of the population means are equal. It does not test for which pairs of means are not equal.
Question 12.58
2. Clarify why we do not perform multiple comparisons if we did not reject the null hypothesis in the original ANOVA. (p. 686)
Question 12.59
3. What is a pairwise comparison? Explain how we calculate how many pairwise comparisons there are. (p. 686)
12.2.3
It is performing a hypothesis test to determine whether two means are different. C=Ck2=K![2!(k−2)!], where k is the number of populations.
Question 12.60
4. What do we mean by experimentwise error rate? (p. 686)
Question 12.61
5. How does the Bonferroni adjustment correct for the greater size of the experimentwise error rate? (p. 686)
12.2.5
By multiplying the p-value of each pairwise hypothesis test by the number of comparisons being made
Question 12.62
6. What do we do if the Bonferroni adjustment results in an adjusted p-value greater than 1? Why must we do this? (p. 686)
Question 12.63
7. What are the requirements for performing multiple comparisons using either the Bonferroni method or Tukey's test? (pp. 687-688)
12.2.7
The requirements for ANOVA have been met and the null hypothesis that the population means are all equal has been rejected.
Question 12.64
8. What is the rejection rule for using confidence intervals to perform Tukey's test? (p. 689)
PRACTICING THE TECHNIQUES
 CHECK IT OUT!
| To do | Check out | Topic |
|---|---|---|
| Exercises 9–18 | Example 7 | Bonferroni method of multiple comparisons |
| Exercises 19–30 | Example 8 | Tukey's test for multiple comparisons |
| Exercises 31–32 | Example 9 | Using confidence intervals to perform Tukey's test |
For Exercises 9–14, use the summary statistics to calculate the value of the test statistic tdata for the Bonferroni method.
Question 12.65
9. ˉx1=85, ˉx2=75, MSE = 25, n1=10, n2=10
12.2.9
tdata=4.472
Question 12.66
10. ˉx1=85, ˉx3=65, MSE = 25, n1=10, n3=10
Question 12.67
11. ˉx2=75, ˉx3=65, MSE = 25, n2=10, n3=10
12.2.11
tdata=4.472
Question 12.68
12. ˉx1=100, ˉx2=105, MSE = 100, n1=8, n2=8
Question 12.69
13. ˉx1=100, ˉx3=85, MSE = 100, n1=8, n3=8
12.2.13
tdata=3
Question 12.70
14. ˉx2=105, ˉx3=85, MSE = 100, n2=8, n3=8
For Exercises 15 and 16, perform multiple comparisons using the Bonferroni method at level of significance α=0.05, for the data indicated. Assume the requirements are met. Do the following:
- For each hypothesis test, state the hypotheses and the rejection rule.
- Use the value of tdata from Exercises 9–14 for each hypothesis test.
- Find the Bonferroni-adjusted p-value for each hypothesis test.
- For each hypothesis test, state the conclusion and the interpretation.
Question 12.71
15. The data from Exercises 9–11
12.2.15
(a) Test 1: H0:μ1=μ2 vs. Ha:μ1≠μ2; Test 2: H0:μ1=μ3 vs. Ha:μ1≠μ3. Ha:μ1≠μ3; Test 3: H0:μ2=μ3 vs. Ha:μ2≠μ3. For each hypothesis test, reject H0 if the Bonferroni-adjusted p-value≤α=0.05. (b) Test 1: tdata=4.472; Test 2: tdata=8.944; Test 3: tdata=4.472 (c) Test 1: Bonferroni-adjusted p-value= 0.0004; Test 2: Bonferroni-adjusted p-value= 0; Test 3: Bonferroni-adjusted p-value= 0.0004 (d) Test 1: The adjusted p-value= 0.0004, which is ≤0.05; therefore we reject H0. There is evidence at the α=0.05 level of significance that the population mean of Population 1 differs from the population mean of Population 2. Test 2: The adjusted p-value= 0, which is ≤0.05; therefore we reject H0. There is evidence at the α=0.05 level of significance that the population mean of Population 1 differs from the population mean of Population 3. Test 3: The adjusted p-value= 0.0004, which is H0; therefore we reject H0. There is evidence at the α=0.05 level of significance that the population mean of Population 2 differs from the population mean of Population 3.
Question 12.72
16. The data from Exercises 12–14
For Exercises 17 and 18, assume the ANOVA requirements are met. If appropriate, perform multiple comparisons using the Bonferroni method with individual level of significance α=0.01 for the indicated data. If not appropriate to perform multiple comparisons, state why not.
Question 12.73
17. The data from Exercise 19, Section 12.1
12.2.17
Test 1: H0:μA=μB vs. Ha:μA≠μB; Test 2: H0:μA=μC vs. Ha:μA≠μC; Test 3: H0:μB=μC vs. Ha:μB≠μC. For each hypothesis test, reject H0 if the Bonferroni-adjusted p-value≤α=0.01. Test 1: tdata=−3.162; Test 2: tdata=3.162; Test 3: tdata=6.325. Test 1: Bonferroni-adjusted p-value= 0.0246; Test 2: Bonferroni-adjusted p-value= 0.0246; Test 3: Bonferroni-adjusted p-value= 0.0001. Test 1: The adjusted p-value= 0.0246, which is not ≤0.01; therefore we do not reject H0. There is insufficient evidence at the α=0.01 level of significance that the population mean of Population A differs from the population mean of Population B. Test 2: The adjusted p-value= 0.0246, which is not ≤0.01; therefore we do not reject H0. There is insufficient evidence at the α=0.01 level of significance that the population mean of Population A differs from the population mean of Population C. Test 3: The adjusted p-value= 0.0001, which is ≤0.01; therefore we reject H0. There is evidence at the α=0.01 level of significance that the population mean of Population B differs from the population mean of Population C.
Question 12.74
18. The data from Exercise 20, Section 12.1
For Exercises 19–24, use the summary statistics to calculate the value of the test statistic qdata for Tukey's test.
Question 12.75
19. ˉx1=60, ˉx2=61, MSE = 100, n1=50, n2=50
12.2.19
qdata=0.707
Question 12.76
20. ˉx1=60, ˉx3=65, MSE = 100, n1=50, n3=50
Question 12.77
21. ˉx2=61, ˉx3=65, MSE = 100, n2=50, n3=50
12.2.21
qdata=2.828
Question 12.78
22. ˉx1=220, ˉx2=200, MSE = 450, n1=25, n2=25
Question 12.79
23. ˉx1=220, ˉx3=210, MSE = 450, n1=25, n3=25
12.2.23
qdata=2.357
Question 12.80
24. ˉx2=200, ˉx3=210, MSE = 450, n2=25, n3=25
For Exercises 25 and 26, find the critical value qcrit.
Question 12.81
25. Experimentwise error rate αEW=0.05, n1=50, n2=50, n3=50
12.2.25
qcrit=3.356
Question 12.82
26. Experimentwise error rate αEW=0.05, n1=25, n2=25, n3=25
For Exercises 27 and 28, perform multiple comparisons using Tukey's test at experimentwise error rate αEW=0.05, for the data indicated. Assume the requirements are met. Do the following:
- For each hypothesis test, state the hypotheses.
- Use the value of qcrit from Exercises 25 or 26, and state the rejection rule.
- Use qdata from Exercises 19–24 for each hypothesis test.
- For each hypothesis test, state the conclusion and the interpretation.
Question 12.83
27. The data from Exercises 19–21
12.2.27
(a) Test 1: H0:μ1=μ2 vs. Ha:μ1≠μ2; Test 2: H0:μ1=μ3 vs. Ha:μ1≠μ3; Test 3: H0:μ2=μ3 vs. Ha:μ2≠μ3. (b) qcrit=3.356. Reject H0 if qdata≥3.356; (c) Test 1: qdata=0.707; Test 2:qdata=3.536; Test 3:qdata=2.828 (d) Test 1:qdata=0.707, which is not ≥3.356; therefore we do not reject H0. There is insufficient evidence at the α=0.05 level of significance that the population mean of Population 1 differs from the population mean of Population 2. Test 2 qdata=3.536, which is ≥3.356; therefore we reject H0. There is evidence at the α=0.05 level of significance that the population mean of Population 1 differs from the population mean of Population 3. Test qdata=2.828, which is not ≥3.356; therefore we do not reject H0. There is insufficient evidence at the α=0.05 level of significance that the population mean of Population 2 differs from the population mean of Population 3.
Question 12.84
28. The data from Exercises 22–24
For Exercises 29 and 30, assume the ANOVA requirements are met. If appropriate, perform multiple comparisons using Tukey's test with experimentwise error rate αEW=0.05 for the indicated data. If not appropriate to perform multiple comparisons, state why not.
Question 12.85
29. The data from Exercise 21, Section 12.1
12.2.29
Test 1:H0:μA=μB vs. Ha:μA≠μB; Test 2: H0:μA=μC vs. Ha:μA≠μC; Test 3: H0:μA=μD vs. Ha:μA≠μD; Test 4: H0:μB=μC vs. Ha:μB≠μC; Test 5: H0:μB=μD vs. Ha:μB≠μD; Test 6: H0:μC=μD vs. Ha:μC≠μD; qcrit=3.685. For each hypothesis test, reject H0 if qdata≥3.685. Test 1:qdata=53.484, which is ≥3.685; therefore we reject H0. There is evidence at the α=0.05 level of significance that the population mean of Population A differs from the population mean of Population B. Test 2:qdata=112.755, which is ≥3.685; therefore we reject H0. There is evidence at the α=0.05 level of significance that the population mean of Population A differs from the population mean of Population C. Test 3: qdata=175.069, which is ≥3.685; therefore we reject H0. There is evidence at the α=0.05 level of significance that the population mean of Population A differs from the population mean of Population D. Test 4:qdata=63.926, which is ≥3.685; therefore we reject H0. There is evidence at the α=0.05 level of significance that the population mean of Population B differs from the population mean of Population C. Test 5: qdata=133.711, which is ≥3.685; therefore we reject H0. There is evidence at the α=0.05 level of significance that the population mean of Population B differs from the population mean of Population D. Test 6: qdata=72.783, which is ≥3.685; therefore we reject H0. There is evidence at the α=0.05 level of significance that the population mean of Population C differs from the population mean of Population D.
Question 12.86
30. The data from Exercise 22, Section 12.1
For Exercises 31 and 32, use the indicated output to perform Tukey's test, using the confidence interval method, to determine if significant pairwise differences exist among the population means.
Question 12.87
31. Minitab output in Figure 27, for groups A, B, and C
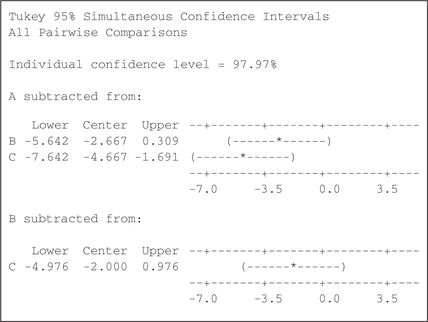
12.2.31
Test 1: H0:μA=μB vs Ha:μA≠μB. 95% confidence interval for μB−μA is (–5.642, 0.309), which does contain zero, so we do not reject H0:μA−μB for level of significance α=0.05. Test 2: H0:μA=μC vs Ha:μA≠μC. 95% confidence interval for μC−μA is (–7.642, −1.691), which does not contain zero, so we reject H0:μA=μC for level of significance α=0.05. Test 3: H0:μB=μC vs Ha:μA≠μC. 95% confidence interval for μC=μB is (–4.976, 0.976), which does contain zero, so we do not reject H0:μB=μC for level of significance α=0.05.
Question 12.88
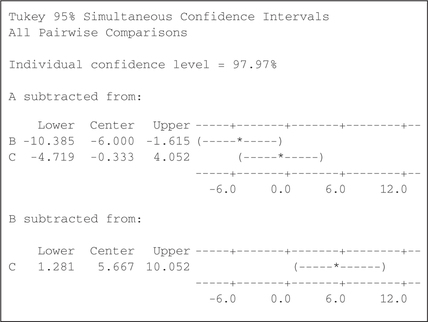
32. Minitab output in Figure 28, for groups A, B, and C
APPLYING THE CONCEPTS
For Exercises 33–36, assume the ANOVA requirements are met. If appropriate, perform multiple comparisons using the Bonferroni method with individual level of significance α=0.01 for the indicated data. If not appropriate to perform multiple comparisons, state why not.
Question 12.89
33. Student-Run Café Business. The data from Exercise 31, Section 12.1
12.2.33
Not appropriate since the conclusion is do not reject H0.
Question 12.90
34. Weight and Age. The data from Exercise 33, Section 12.1
Question 12.91
35. Do Taller People Have Lower Voices? The data from Exercise 41, Section 12.1
12.2.35
See Solutions Manual.
Question 12.92
36. Gas Mileage for European, Japanese, and American Cars. The data from Exercise 48, Section 12.1
For Exercises 37–40, assume the ANOVA requirements are met. If appropriate, perform multiple comparisons using Tukey's test with experimentwise error rate αEW=0.05 for the indicated data. If not appropriate to perform multiple comparisons, state why not.
Question 12.93
37. The Professionals versus the Darts. The data from Exercise 32, Section 12.1
12.2.37
Not appropriate since the conclusion is do not reject H0.
Question 12.94
38. The Full Moon and Emergency Room Visits. The data from Exercise 34, Section 12.1
Question 12.95
39. Nutritional Rating of Breakfast Cereals. The data from Exercise 45, Section 12.1
12.2.39
See Solutions Manual.
Question 12.96
40. Head Injuries and Vehicle Year. The data from Exercise 52, Section 12.1