6.1 Exploring Data: Relationships 6

- 6.1 Displaying Relationships: Scatterplot
- 6.2 Making Predictions: Regression Line
- 6.3 Correlation
- 6.4 Least-Squares Regression
- 6.5 Interpreting Correlation and Regression
In Chapter 5, we analyzed data one variable at a time. In Chapter 6, we analyze data on two (or more) variables simultaneously. For example, medical studies have linked weight and the risk of heart disease. Heavier people are more likely to develop the disease than those of average weight. Data from the Bureau of Labor Statistics (BLS) indicate that there is a relationship between the educational attainment of Americans and both earnings and unemployment. In general, those with high levels of education earn more and are less likely to be unemployed, whereas the reverse is true for the least educated Americans. A report prepared for the U.S. Department of Energy finds that as vehicle footprint (a measure of vehicle size) increases, fatality risk to drivers decreases. Moreover, vehicle footprint and weight are correlated, and as vehicle weight increases, fuel efficiency decreases. All these studies focused on investigating relationships between two variables.
In this chapter, we explore the relationship between two variables, measured on the same individuals. If we measure the height and weight of each individual in a large group of people, we know which height goes with each weight. These data allow us to study the connections between height and weight, whereas a list of heights and a separate list of weights—two sets of single-variable data—do not provide information about the possible connections between height and weight.
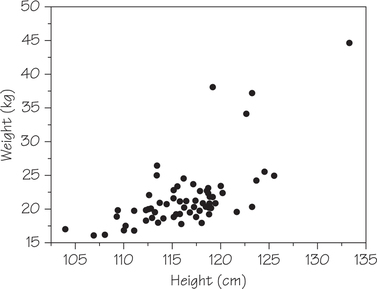
In Chapter 5, we used histograms, dotplots, and boxplots to extract information from data on a single variable such as weight. In this chapter, we expand our graphical tools to include scatterplots in order to visually explore the relationships between two variables such as weight and height. For example, the scatterplot in Figure 6.1 shows how the weights of 4-year-olds are related to their heights.
As we delve into relationships in this chapter, we will find cases where a scatterplot shows a linear pattern. In such cases, we will summarize that pattern by drawing a line and then use the line to make predictions. In order to judge just how tightly data hug a straight line, we will calculate the correlation, a numerical measure of the strength of the linear relationship. For more precise predictions, we’ll need to obtain the equation of a line that best fits the data. Then, after learning data analysis techniques for extracting information from two related variables, we’ll discuss some limitations of those techniques.