6.4 Climate at the Crossroads
Weigh the evidence of an anthropogenic greenhouse effect in the atmosphere and describe its consequences.
The transfer of carbon from long-
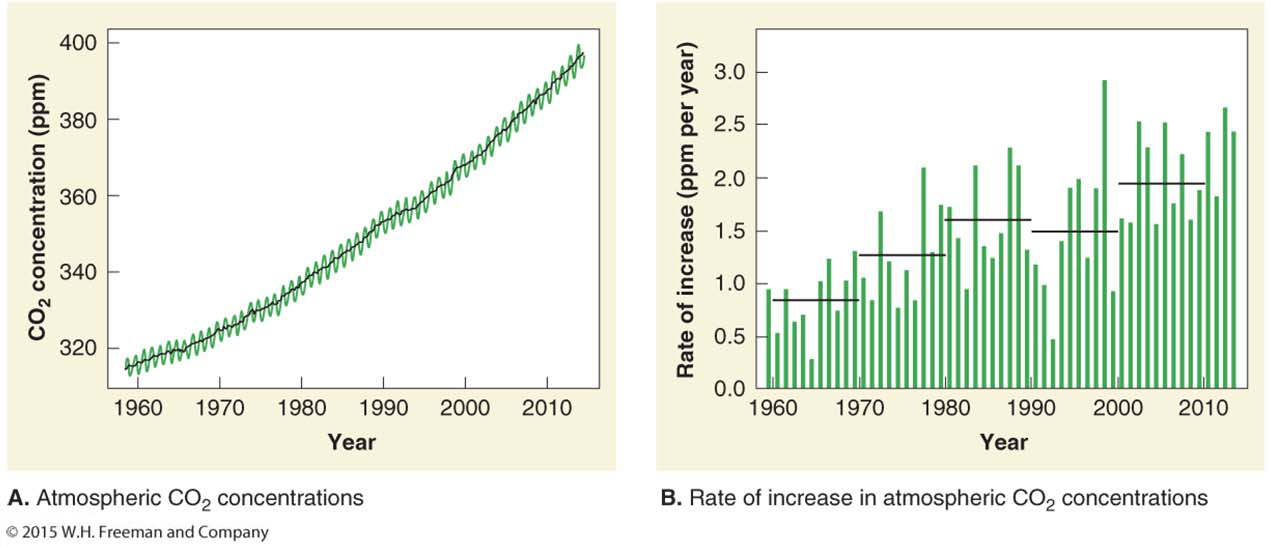
Human activity is increasing atmospheric CO2 concentrations by 2.5 parts per million (ppm) per year. Precise measurements of atmospheric CO2 were begun by Charles Keeling in 1958 at Mauna Loa Observatory in Hawai‘i. The observatory is far away from the effects of cities and pollution, and the measurements are taken upwind of any volcanic emissions. The Keeling curve is a graph showing the change in atmospheric CO2 concentrations since 1958 (Figure 6.14).
Keeling curve
A graph showing the change in atmospheric CO2 concentrations since 1958.
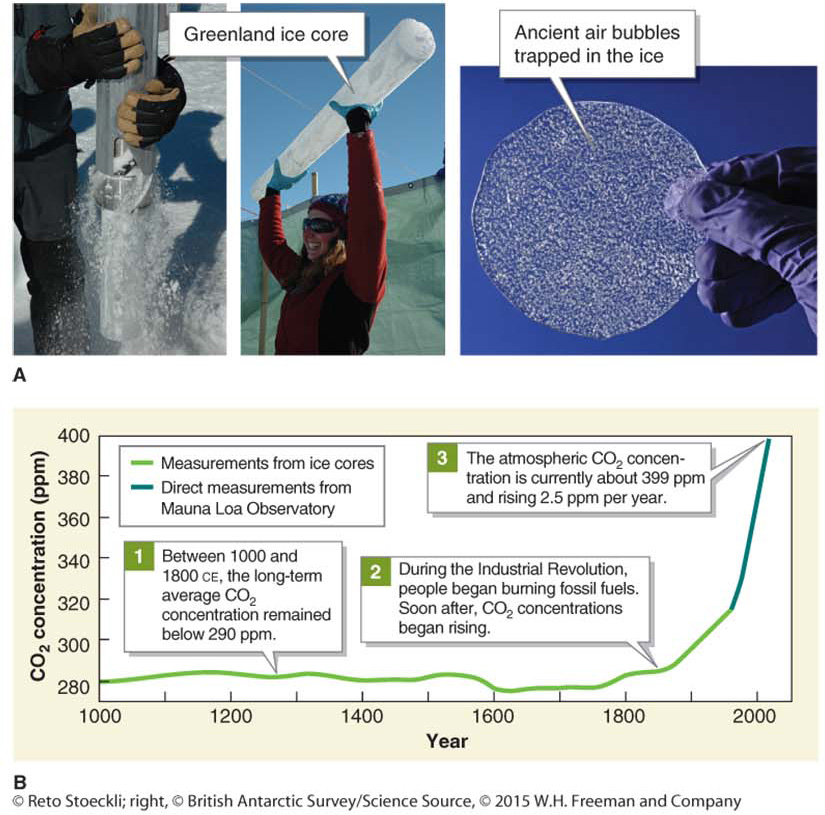
But what were atmospheric CO2 concentrations before 1958, when Keeling and other scientists began measuring them? To find out, scientists have analyzed air bubbles in ancient ice from the Greenland and Antarctic ice sheets (Figure 6.15). They found that before 1800, CO2 concentrations were much lower than they are today. Atmospheric CO2 increased after societies began burning fossil fuels in large quantities.
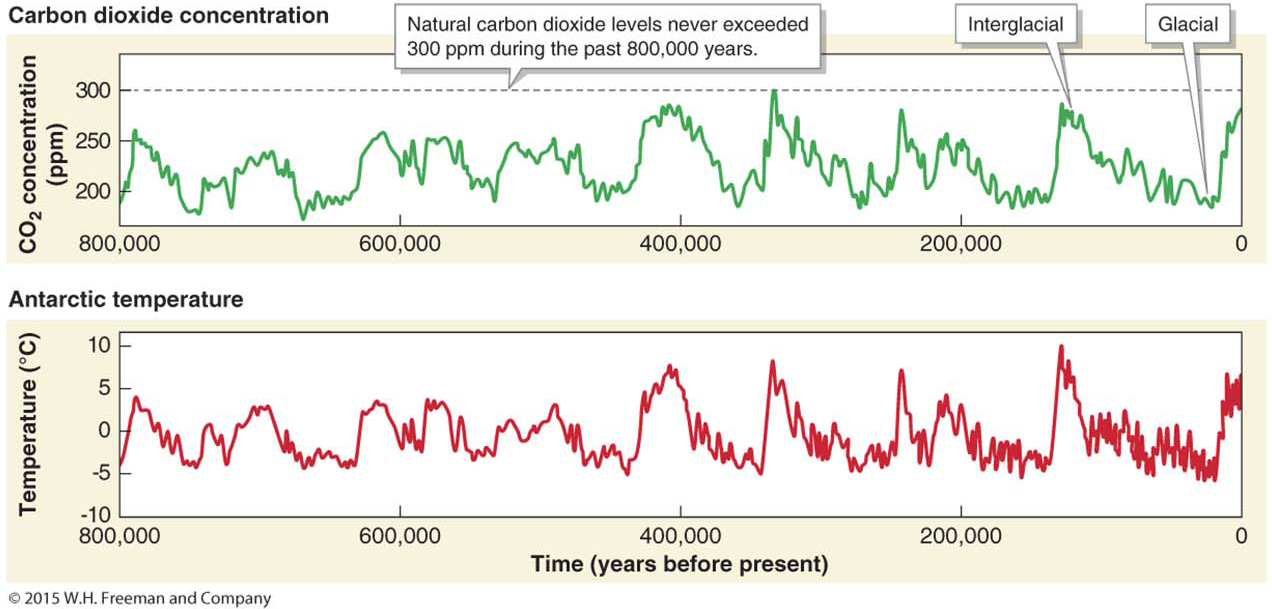
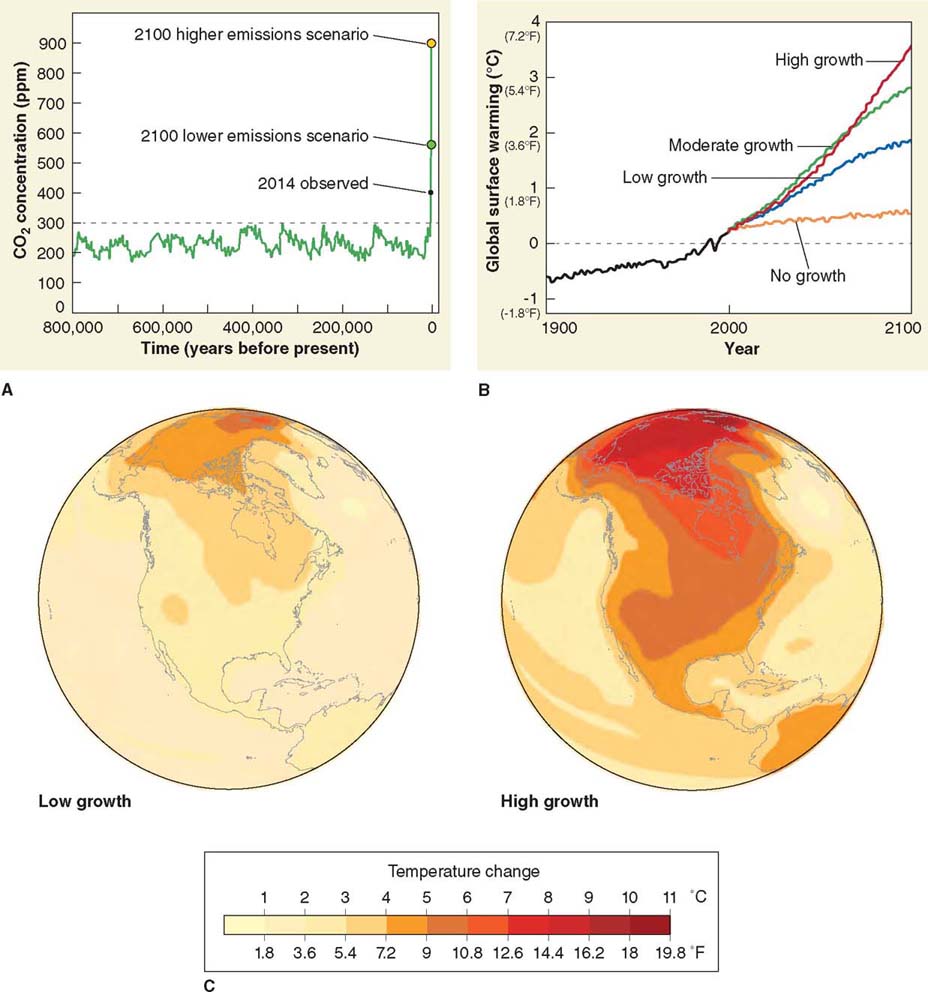
As we have seen, Milankovitch cycles are largely driving the shifts between glacial and interglacial periods. During the past 800,000 years, atmospheric temperatures and CO2 concentrations have changed together, as illustrated in Figure 6.16. During glacial periods, carbon is stored in the oceans, and during interglacial periods, large amounts of carbon are transferred from the oceans to the atmosphere. Photosynthetic plants and algae cause these changes as they grow and absorb CO2 from the atmosphere and as they die and release the carbon they absorbed back to the atmosphere.
The Warming Atmosphere
During the last 800,000 years, natural atmospheric CO2 concentrations never exceeded 300 ppm, but today’s concentrations have risen to about 400 ppm. This increase is a result of the addition of CO2 to the atmosphere by human activities. Human emissions of CO2 and other greenhouse gases into the atmosphere are creating an anthropogenic greenhouse effect: an enhancement of the natural greenhouse effect that is warming the planet.  The Geographic Perspectives at the end of this chapter explores how we can reduce our CO2 emissions to address this problem.
Carbon dioxide is the most important contributor to the anthropogenic greenhouse effect. Because CO2 concentrations and temperatures increase and decrease together, atmospheric temperatures are expected to rise to match the rising CO2 concentrations, and as Figure 6.17 shows, that is already happening.
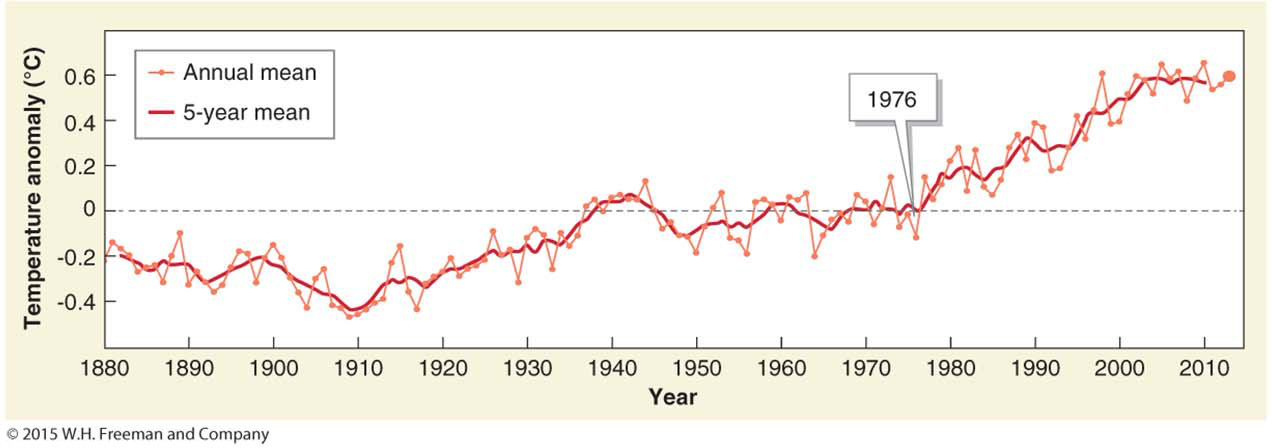

According to NASA, Earth’s average temperature in 2013 was 14.6°C (58.3°F). The rate of warming fluctuates from year to year, but is about 0.013°C (0.023°F) per year on average. Crunch the Numbers uses these data to calculate a rough estimate of Earth’s average temperature by the year 2050.
Your results in Crunch the Numbers are likely to be an underestimate because the rate of warming is not expected to remain constant. Nonlinear positive feedbacks, such as the ice-
The ice-
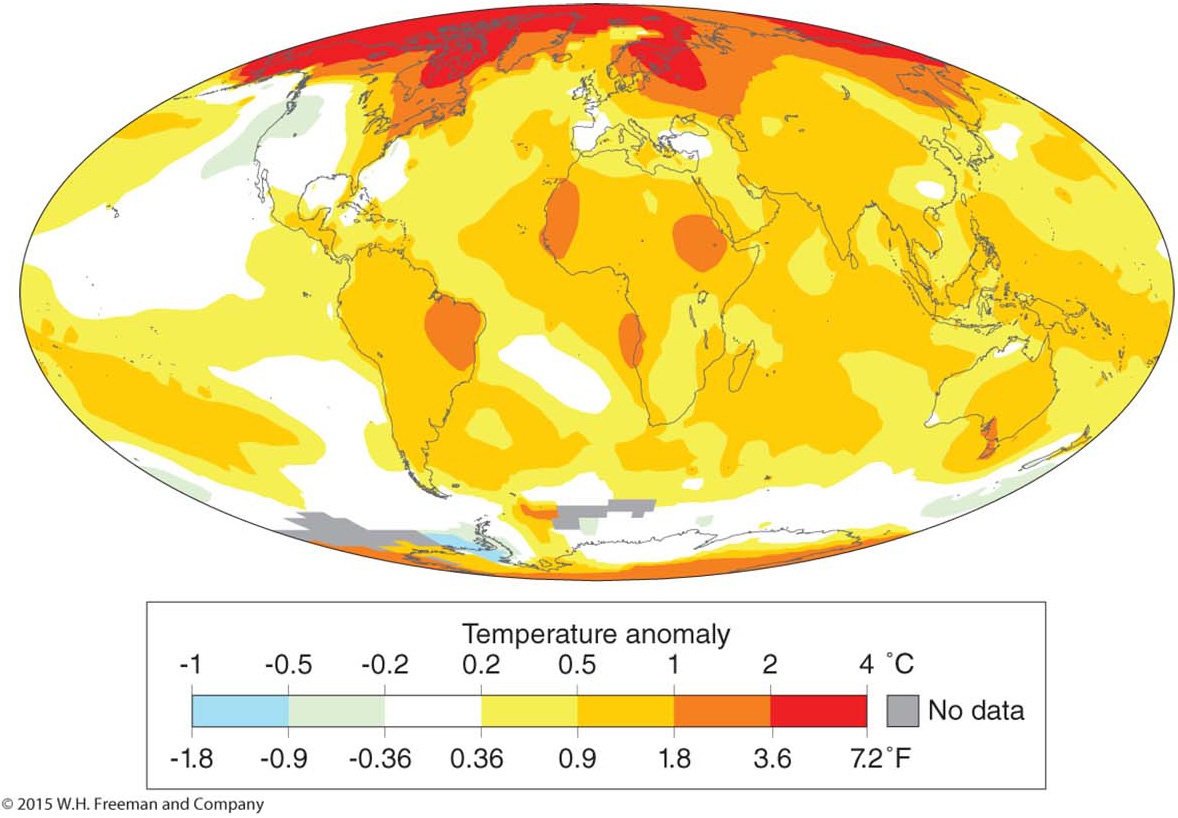
Given its accelerated rate of warming, the Arctic will continue to experience the greatest temperature shifts on the planet. Antarctica is also warming, but not as quickly, because it is relatively isolated by the Antarctic circumpolar current that flows around it.
Comparing Today with the Last 800,000 Years
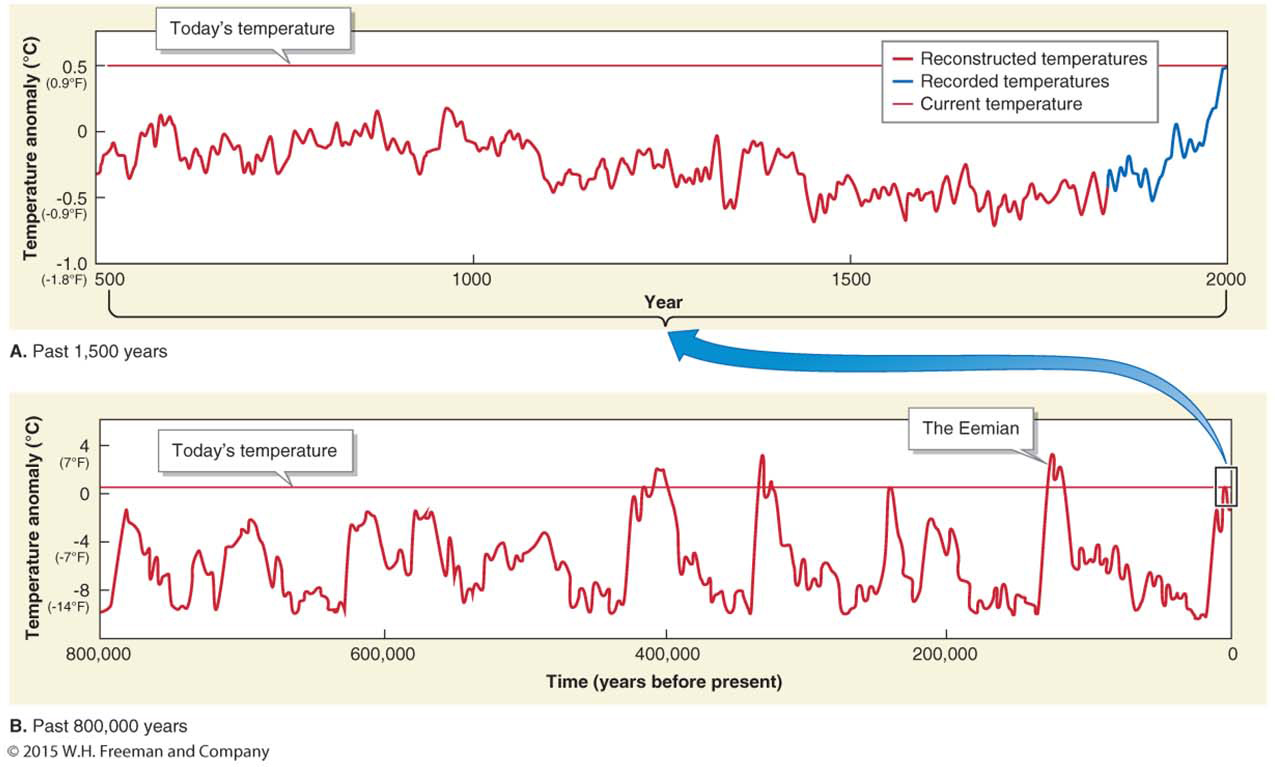
Research on ice cores from Antarctica and Greenland has given scientists a firm understanding of atmospheric chemistry and temperature during the last 800,000 years.Earth’s average atmospheric temperature is higher now than at any time in the last 1,500 years. But within the context of the last 800,000 years, there were periods warmer than today (Figure 6.19).
CRUNCH THE NUMBERS: Earth’s Temperature in the Year 2050
CRUNCH THE NUMBERS: Earth’s Temperature in the Year 2050
Calculate Earth’s average temperature for 2050, assuming that the current rate of warming remains constant.
In degrees Celsius:
Question 6.8
Calculate how many years to 2050:
Question 6.9
Multiply the number of years by the annual rate of increase:
Question 6.10
Add the temperature increase to the current average:
In degrees Fahrenheit:
Question 6.11
Calculate how many years to 2050:
Question 6.12
Multiply the number of years by the annual rate of increase:
Question 6.13
Add the temperature increase to the current average:
The most recent of those warm periods was the Eemian (also called the Sangamonian) interglacial, during which temperatures were about 1°C (1.8°F) above today’s average. Eemian sea level was about 4 to 6 m (13 to 20 ft) higher than today’s due to the melting of glaciers at high latitudes. Although temperatures during the Eemian were warmer than today’s, atmospheric CO2 concentrations never rose above 300 ppm. Because CO2 and temperature are coupled (see Figure 6.16), it stands to reason that the atmosphere will get warmer in the next century than it was in the Eemian because atmospheric CO2 concentrations are already higher and are quickly rising.
Is the Warming Trend Natural?
Given the evidence, the current warming trend can be explained only by the current increase in atmospheric CO2 concentrations caused by human activities. There is no known natural phenomenon that can account for this warming trend (Figure 6.20).
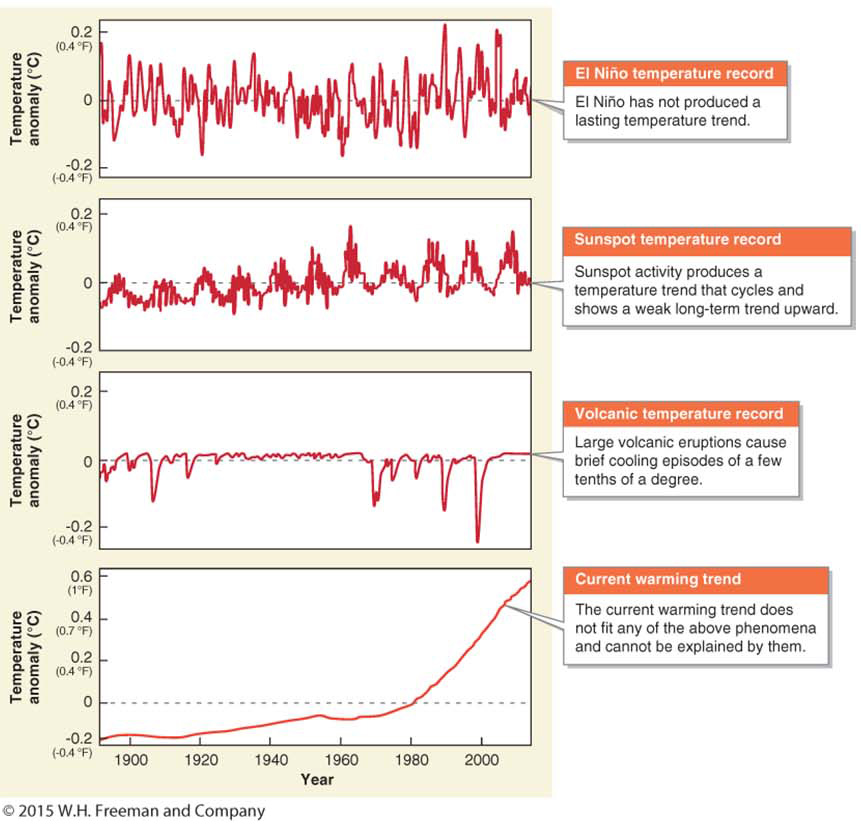
Several key observations point to the anthropogenic increase in atmospheric CO2 concentrations as the cause of the observed warming trend:
Question 6.14
Are people causing climate change?
All available evidence points to human activities as the primary cause of Earth’s warming atmosphere.
The rapid pace of atmospheric warming-
mirrors the rapid pace of CO2 increase in the atmosphere. The nights are warming faster than the days. Greenhouse gases absorb outgoing terrestrial heat both day and night. The warming is most pronounced at night, however, when Earth is losing the heat it absorbed during the day.
The lower stratosphere is cooling. This trend in the stratosphere is caused mainly by increased heat retention in the lower troposphere due to the increase of greenhouse gases.
A Strange New World
One question about climate change that often arises is this: “Climate change has happened before. Why should people be concerned?” Whether natural or anthropogenic, any kind of climate change can be destabilizing for human societies. There are 7 billion people living today, and the population may reach 9 billion by 2050. Complex societies are vulnerable to small changes in climate, which could result in major demographic, economic, and environmental shifts. Human societies have developed during 10,000 years of stable Holocene climate. Any change to the climate system, natural or anthropogenic, will challenge modern societies.
Positive Changes
A warming world will have positive aspects for some societies. Some countries may benefit agriculturally. Canada, for example, may improve its agricultural output and may even switch to growing corn in the near term. England is at the northernmost limit of wine-
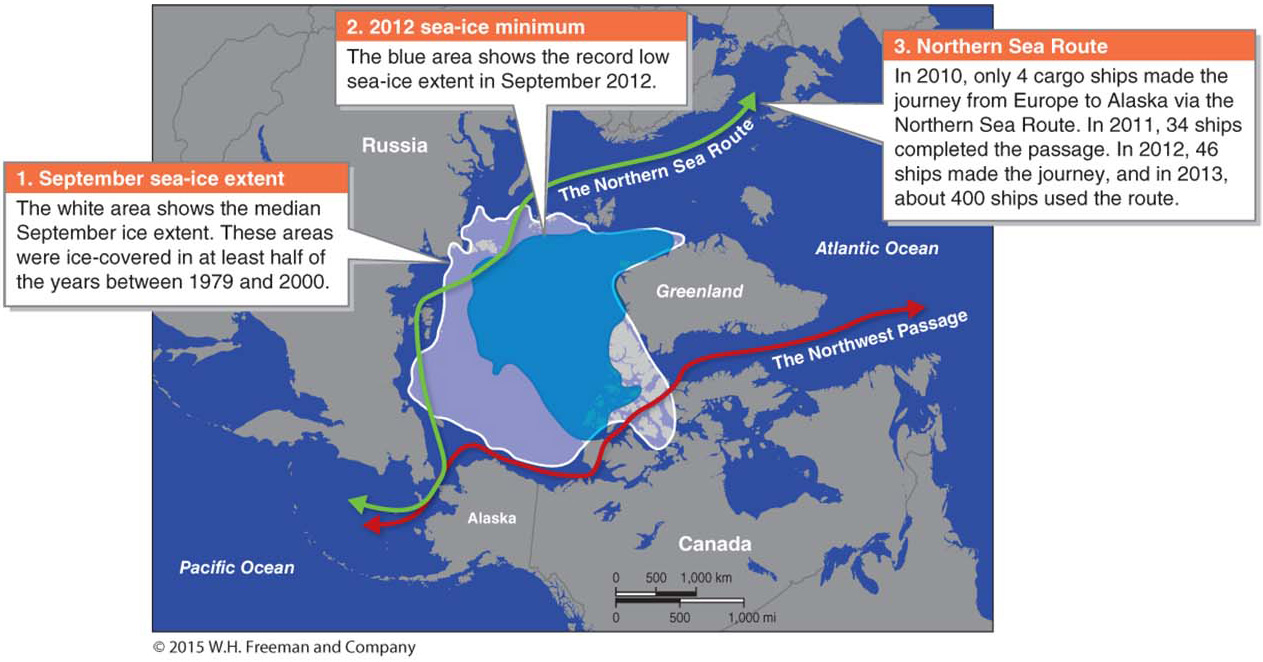
A new Arctic economy based on shipping, cooling fishing, tourism, and petroleum and natural gas exploration is already opening up. According to the USGS, the Arctic could provide some 30% of the world’s natural gas in the coming years. Arctic shipping routes have been blocked by ice year-
Shifting Physical Systems
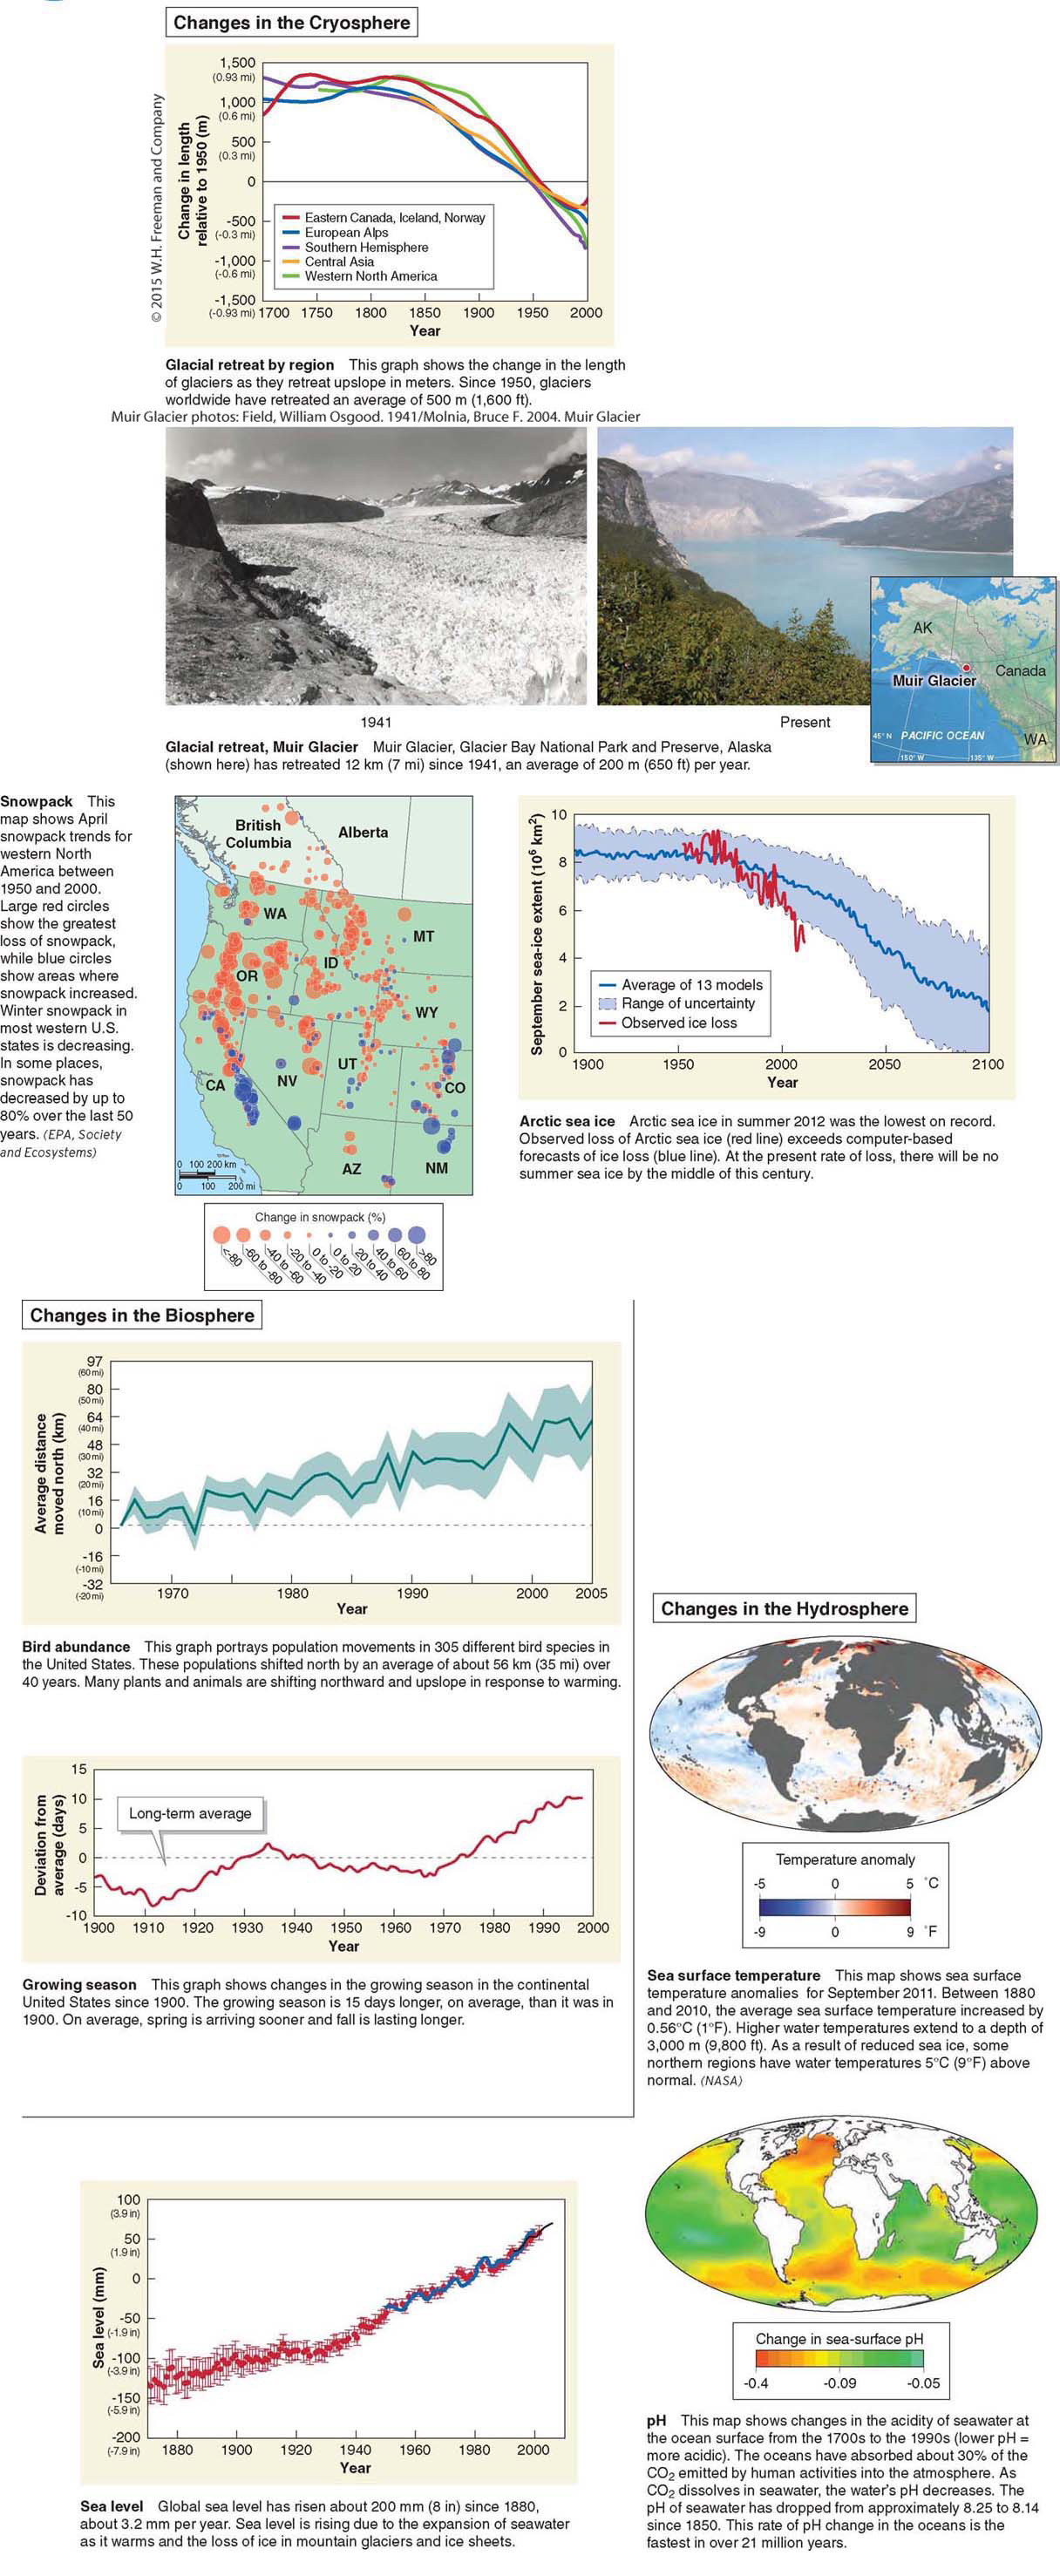
Benefits such as these are minor, however, compared with the detrimental effects of a warming world. With each passing year, evidence mounts that rapid shifts in Earth’s physical systems are underway. These shifts raise serious concerns for human populations in the coming decades. Figure 6.22 presents some of the changes currently happening in Earth’s physical systems. In the next 50 years, these changes are certain to continue.
The following is a brief summary of some of the major anticipated changes to Earth’s systems:
Sea level: The Intergovernmental Panel on Climate Change (IPCC) projects that by 2100, sea level is likely to rise up to 1.2 m (46 in, or nearly 4 ft). Additionally, new research published in May 2014 in Science found that as the west Antarctic ice sheet thins and flows into the ocean, even more sea level rise is inevitable. Extreme weather: The combination of rising temperatures and, in certain regions, increasing evaporation due to warmer temperatures is now leading to both more drought and more flooding rains. Satellite data show that between 1987 and 2006, average annual global precipitation amounts increased 7.4% as a result of fewer but more intense storms, not more storms.
Atmospheric circulation: Climate models project that the downward limbs of the Hadley cells (see Section 4.3) could migrate poleward as the equator-
to- pole temperature gradient lessens. Such a shift would change wind and precipitation patterns at midlatitudes worldwide. Extinctions: Many species are now moving upslope and to higher and cooler latitudes in response to warming temperatures (see Figure 6.22). As species continue this migration response, cities, highways, farms, and other human-
built landscapes will impede their movement. For this reason, biologists anticipate that many species will go extinct as they attempt to find suitable habitat.
Computers and Climate Projections
Climatologists use Earth system models to develop predictions about how climate might respond to greenhouse gas forcing. An Earth system model is a mathematical simulation of the behavior of the atmosphere, oceans, and biosphere that can be used to create long-
Earth system model
A mathematical simulation of the behavior of the atmosphere, oceans, and biosphere; used to create long-
According to the Intergovernmental Panel on Climate Change, most models project a temperature increase in the lower atmosphere ranging from 2°C to 6°C (3.6°F to 10.8°F) by the end of this century. This range of uncertainty results from various factors. For example, there is uncertainty as to how much CO2 will be emitted by human activities in the coming years (Figure 6.23). There are also many complicating factors, such as cloud feedbacks (see Section 3.6), that affect the climate system.
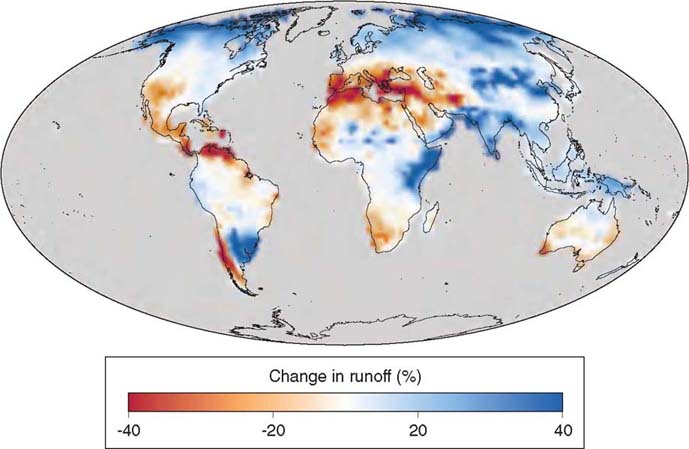
Climate change is expected to change precipitation patterns. Much of Canada and the northeastern United States are expected to receive increased precipitation. The southwestern United States and the Mediterranean are expected to become drier. For many regions, changes in precipitation coupled with changes in temperature are projected to alter stream runoff significantly (Figure 6.24), and these changes will alter the availability of surface water for human use.
More than a half century of evidence and over 50,000 published scientific papers fact-