6.1 Area Between GraphsPrinted Page 405
405
OBJECTIVES
When you finish this section, you should be able to:
When a function \(f\) is continuous and nonnegative on a closed interval \([a,b]\), then the definite integral \begin{equation*} \int_{a}^{b}f(x) \,{\it dx} \end{equation*}
equals the area under the graph of \(y=f(x)\) from \(a\) to \(b\). In this section, we relax the restriction that \(f(x)\) is nonnegative and extend the interpretation of the definite integral to find the area enclosed by the graphs of two functions.
1 Find the Area Between the Graphs of Two Functions by Partitioning the \(x\)-AxisPrinted Page 405
Suppose we want to find the area \(A\) of the region enclosed by the graphs of \(y=f(x)\) and \(y=g(x)\) and the lines \(x=a\) and \(x=b\). Occasionally, the area can be found using geometry formulas and calculus is not needed. But more often the region is irregular, and its area is found using definite integrals.
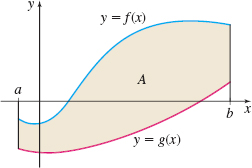
Assume that the functions \(f\) and \(g\) are continuous on the closed interval \([a,b]\) and that \(f(x)\geq g(x)\) for all numbers \(x\) in \([a,b]\), as illustrated in Figure 1. To find the area \(A\) of the region enclosed by the two graphs, we partition the interval \([a,b]\) on the \(x\)-axis into \(n\) subintervals: \begin{equation*} \lbrack x_{0}, x_{1}], [x_{1},x_{2}], \ldots , [x_{i-1},x_{i}], \ldots , [x_{n-1}, x_{n}]\qquad x_{0}=a \quad x_{n}=b \end{equation*}
each of width \(\Delta x=\dfrac{b-a}{n}\). For each \(i, i = 1,2,\ldots,n\), we select a number \(u_{i}\) in the subinterval \([x_{i-1}, x_{i}].\) Then we construct \(n\) rectangles, each of width \(\Delta x\) and height \(f(u_{i})-g(u_{i})\). The area of the \(i\)th rectangle is \([f(u_{i})-g(u_{i})] \Delta x\). See Figure 2.
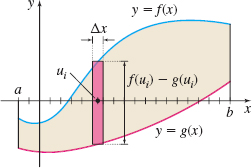
The sum of the areas of the \(n\) rectangles, \(\sum\limits_{i=1}^{n}\left[ f(u_{i})-g(u_{i})\right] \Delta x\), approximates the area \(A\) we seek. As the number \(n\) of subintervals increases, these sums become a better approximation to the area \(A,\) and \begin{align*} A=\lim\limits_{n\rightarrow \infty} \displaystyle \sum_{i=1}^{n}\left[ f(u_{i})-g(u_{i})\right] \Delta x \end{align*}
Since the approximating sums are Riemann sums, and \(f\) and \(g\) are continuous on the interval \([a,b]\), then the limit is a definite integral and \begin{align*} A=\int_{a}^{b}[f(x)-g(x)]~{\it dx} \end{align*}
Area
The area \(A\) of the region enclosed by the graphs of \(y=f(x)\) and \(y=g(x)\), and the lines \(x=a\) and \(x=b\), where \(f\) and \(g\) are continuous on the interval \([a, b]\) and \(f(x)\geq g(x)\) for all numbers \(x\) in \([a, b]\), is \begin{equation*} \bbox[5px, border:1px solid black, #F9F7ED]{ A= \int_{a}^{b}[f(x)-g(x)]\, {\it dx}}\tag{1} \end{equation*}
406
EXAMPLE 1Finding the Area Between the Graphs of Two Functions
Find the area of the region enclosed by the graphs of \(f(x) =e^{x}\) and \(g(x) =\sqrt{x}\) and the lines \(x=0\) and \(x=1\).
Solution We begin by graphing the two functions and identifying the area \(A\) to be found. See Figure 3.
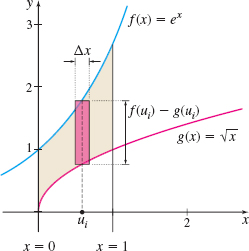
From the graph, we see that \(f(x) \geq g(x)\) on the interval \([0,1]\). Then, using the definition of area, we have \begin{eqnarray*} A &=&\int_{a}^{b}[f(x)-g(x)]~{\it dx}=\int_{0}^{1}( e^{x}-\sqrt{x}) ~{\it dx}\\[2pt] &=&\int_{0}^{1}e^{x}~{\it dx}-\int_{0}^{1}x^{1/2}~{\it dx}=\big[ e^{x}\big] _{0}^{1}-\left[ \dfrac{x^{3/2}}{\dfrac{3}{2}}\right] _{0}^{1} \\[5pt] &=&( e^{1}-e^{0}) -\dfrac{2}{3}( 1-0) =e-1-\dfrac{2}{3}=e-\dfrac{5}{3} \hbox{ square units} \end{eqnarray*}
NOW WORK
The definition of area (1) holds whether the graphs of \(f\) and \(g\) lie above the \(x\)-axis, below the \(x\)-axis, or partially above and partially below the \(x\)-axis as long as \(f(x) \geq g(x)\) on \(\left[a,b\right]\). It is critical to graph \(f\) and \(g\) on \([a,b]\) to determine the relationship between the graphs of \(f\) and \(g\) before setting up the integral. The key is to always subtract the smaller value from the larger value. This ensures that the height of each rectangle is positive.

EXAMPLE 2Finding the Area Between the Graphs of Two Functions
Find the area of the region enclosed by the graphs of \(f(x)=10x-x^{2}\) and \(g(x)=3x-8\).
Solution First we graph the two functions. See Figure 4.
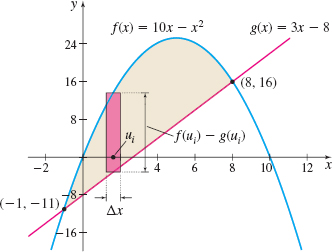
The area we seek lies between the points of intersection of the graphs. Finding the \(x\)-values of the points of intersection will identify the limits of integration. We solve the equation \(f(x) =g(x)\) to find these values. \begin{eqnarray*} 10x-x^{2} &=&3x-8 \qquad \qquad {\color{#0066A7}{f( x ) =g (x)}} \\[1pt] x^{2}-7x-8 &=&0 \\[1pt] (x+1)(x-8)&=&0 \\[1pt] x &=&-1 \hbox{ or } x=8 \end{eqnarray*}
407
The limits of integration are \(a=-1\) and \(b=8.\) Since \(f(x) \geq g(x)\) on \(\left[ -1,8\right],\) the area \(A\) is given by \begin{eqnarray*} A &=&\int_{a}^{b}[f(x)-g(x)]~{\it dx}=\int_{-1}^{8}[(10x-x^{2})-(3x-8)]~{\it dx}\\[5pt] &=& \int_{-1}^{8}(-x^{2}+7x+8)~{\it dx}=\left[ \dfrac{-x^{3}}{3}+\dfrac{7x^{2}}{2}+8x \right] _{-1}^{8} \\[5pt] &=&\left( -\dfrac{512}{3}+224+64\right) -\left( \dfrac{1}{3}+\dfrac{7}{2}-8\right) =\dfrac{243}{2}=121.5\hbox{ square units} \end{eqnarray*}
NOW WORK
EXAMPLE 3Finding the Area Between the Graphs of Two Functions
Find the area of the region enclosed by the graphs of \(f(x)=\sin x\) and \(g(x)=\cos x\) from the \(y\)-axis to their first point of intersection in the first quadrant.
Solution First we graph the two functions. See Figure 5.
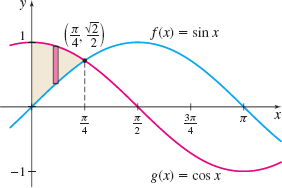
The points of intersection of the two graphs satisfy the equation \(f(x)= g(x)\). \[ \begin{array}{rcl@{\qquad}l} \sin x &=&\cos x & \qquad {\color{#0066A7}{f (x) =g ( x )}} \\[4pt] \tan x &=&1 \end{array} \]
The first point of intersection in the first quadrant occurs at \(x=\tan ^{-1}1=\dfrac{\pi}{4}.\) The graphs intersect at the point \(\left( \dfrac{\pi}{4},\,\dfrac{\sqrt{2}}{2}\right)\), so the area \(A\) we seek lies between \(x=0\) and \(x=\dfrac{\pi}{4}.\) Since \(\cos x\geq \sin x\) on \(\left[ 0,\dfrac{\pi}{4}\right]\), the area \(A\) is given by \begin{eqnarray*} A&=&\int_{0}^{\pi /4}\left( \cos x-\sin x\right) ~{\it dx}=~\big[ \sin x+\cos x \hbox{ }\big] _{0}^{\pi /4}=\left( \frac{\sqrt{2}}{2}+\frac{\sqrt{2}}{2} \right) -(0+1)\\[5pt] &=&\sqrt{2}-1 \hbox{ square units} \end{eqnarray*}
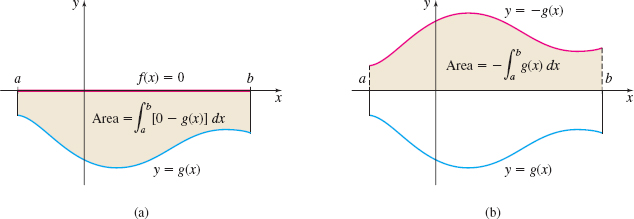
Suppose \(y=g(x)\leq 0\) for all numbers \(x\) in the interval \([a,b]\), as illustrated in Figure 6(a). Then by the definition of area (1), the area \(A\) of the region enclosed by the graph of \(f(x) =0\) (the \(x\)-axis), the graph of \(g\), and the lines \(x=a\) and \(x=b\), is given by \begin{equation*} A=\int_{a}^{b}[ f(x) -g(x) ] ~{\it dx}=\int_{a}^{b}[0-g(x)]~{\it dx}=-\int_{a}^{b}g(x)~{\it dx} \end{equation*}
By symmetry, this area \(A\) is equal to the area under the graph of \(y=-g(x) \geq 0\) from \(a\) to \(b\). See Figure 6(b).
408
EXAMPLE 4Finding the Area Between a Graph and the \(x\)-Axis
Find the area of the region enclosed by the graph of \(f(x)=x^{2}-4\), the \(x\)-axis, and the lines \(x=0\) and \(x=5\).
Solution First we graph the function \(f\). On the interval \([0,5]\), the graph of \(f\) intersects the \(x\)-axis at \(x=2\). As shown in Figure 7, \(f(x)\leq 0\) on the interval \([0, 2]\), and \(f(x)\geq 0\) on the interval \([2,5]\). So, the area \(A\) is the sum of the areas \(A_{1}\) and \(A_{2},\) where \begin{eqnarray*} A_{1} &=&\int_{0}^{2}\left[ ~0-f(x) \right] ~{\it dx}=\int_{0}^{2}-~ ( x^{2}-4) ~{\it dx}=\left[ -\dfrac{x^{3}}{3}+4x\right] _{0}^{2}=- \dfrac{8}{3}+8=\dfrac{16}{3} \\[4pt] A_{2} &=&\int_{2}^{5}f(x) ~{\it dx}=\int_{2}^{5}( x^{2}-4) ~{\it dx}=\left[ \dfrac{x^{3}}{3}-4x\right] _{2}^{5}=\left( \dfrac{125}{3} -20\right) -\left( \dfrac{8}{3}-8\right)\\[4pt] &=&\dfrac{81}{3}=27 \end{eqnarray*}
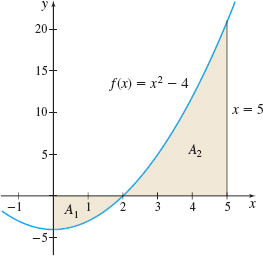
The area \(A\) we seek is \(A=A_{1}+A_{2}=\dfrac{16}{3}+\dfrac{81}{3}=\dfrac{97}{3}\) square units.
NOW WORK
2 Find the Area Between the Graphs of Two Functions by Partitioning the \(y\)-AxisPrinted Page 408
In the previous examples, we found the area by partitioning the \(x\)-axis. Sometimes it is necessary to partition the \(y\)-axis. Look at Figure 8. We seek the area \(A\) of the region enclosed by the graphs and the horizontal lines \(y=c\) and \(y=d\).
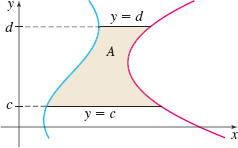
The graphs that form the left and right borders of the region are not the graphs of functions (they fail the Vertical-line Test). Approximating \(A\) by partitioning the \(x\)-axis is not practical. However, both graphs in Figure 8 can be represented as functions of \(y\) since each satisfies the Horizontal-line Test.
THEOREM Horizontal-line Test
A set of points in the \(xy\)-plane is the graph of a function of the form \(x=f(y)\) if and only if every horizontal line intersects the graph in at most one point.
The graphs in Figure 9 satisfy the Horizontal-line Test, so each is a function of \(y\). In Figure 9, the graphs are labeled \(x=g(y)\) and \(x=f(y),\) where \(x=g(y)\) is the horizontal distance from the \(y\)-axis to \(g(y)\), and \(x=f(y)\) is the horizontal distance from the \(y\)-axis to \(f(y)\). Since the graph of \(f\) lies to the right of the graph of \(g\), we know \(f(y)\geq g(y)\).
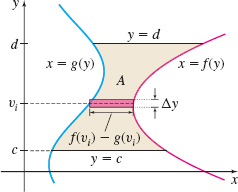
Now to find the area \(A\) of the region enclosed by the two graphs and the horizontal lines \(y=c\) and \(y=d\), we partition the interval \([c,d]\) on the \(y\)-axis into \(n\) subintervals: \[ [ y_{0}, y_{1}] , [ y_{1},y_{2}] , \ldots , [ y_{i-1}, y_{i}] , \ldots , [ y_{n-1}, y_{n}]\qquad y_{0}=c\quad y_{n}=d \]
each of width \(\Delta y=\dfrac{d-c}{n}\). For each \(i, i=1,2,\ldots n\), we select a number \(v_{i}\) in the subinterval \([y_{i-1}, y_{i}]\). Then we construct \(n\) rectangles, each of height \(\Delta y\) and width \(f(v_{i}) -g(v_{i})\). The area of the \(i\)th rectangle is \([f(v_{i}) -g(v_{i})] \Delta y\).
The sum of the areas of the \(n\) rectangles, \(\sum\limits_{i=1}^{n}[f(v_{i})-g(v_{i})] \Delta y\), approximates the area \(A\) we seek. As the number of subintervals increases, the approximation to the area improves, and \begin{equation*} A=\lim\limits_{n\rightarrow \infty }\sum\limits_{i=1}^{n}[f(v_{i})-g(v_{i})]~\Delta y \end{equation*}
409
The approximating sums are Riemann sums, so if \(f\) and \(g\) are continuous on the interval \([c,d]\), then the limit is a definite integral and \[ A=\int_{c}^{d}[f(y)-g(y)]~{\it dy} \]
Area
The area \(A\) of the region enclosed by the graphs of \(x=f(y)\) and \(x=g(y)\), and the horizontal lines \(y=c\) and \(y=d\), where \(f\) and \(g\) are continuous on the interval \([c,\,d]\) and \(f(y)\geq g(y)\) for all numbers \(y\) in \([c,\,d]\), is \begin{equation*} \bbox[5px, border:1px solid black, #F9F7ED]{ A=\int_{c}^{d}[f(y)-g(y)]~{\it dy} } \end{equation*}
EXAMPLE 5Finding Area by Partitioning the \(y\)-Axis
Find the area \(A\) of the region enclosed by the graphs of \(x=f(y)=y+2\) and \(x=g(y)=y^{2}\).
Solution First we graph the two functions and identify the region whose area \(A\) we seek. See Figure 10.
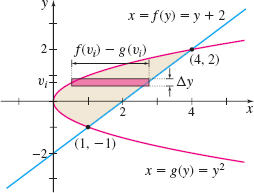
The graphs intersect when \(y+2=y^{2}\). Then \(y^{2}-y-2=(y-2) \left(y+1\right) =0\). So, \(y=2\) or \(y=-1\). When \(y=2, x=4\); when \(y=-1, x=1\). The graphs intersect at the points \((4,2)\) and \(\left(1,-1\right)\).
Notice in Figure 10 that the graph of \(f\) is to the right of the graph of \(g\); that is, \(f(y)\geq g(y)\) for \(-1\leq y\leq 2\). This indicates that we can partition the \(y\)-axis and form rectangles from the left graph (\(x=y^{2}\)) to the right graph \((x=y+2)\) as \(y\) varies from \(-1\) to \(2\). The area \(A\) of the region between the graphs is \begin{eqnarray*} A&=&\int_{-1}^{2}[ f(y)-g(y)] {\it dy}=\int_{-1}^{2}[ ( y+2) -y^{2}] {\it dy}=\left[ \dfrac{y^{2} }{2}+2y-\dfrac{y^{3}}{3}\right] _{-1}^{2}\\[6pt] &=&\left( 2+4-\dfrac{8}{3}\right) -\left( \dfrac{1}{2}-2+\dfrac{1}{3}\right) =4.5\hbox{ square units} \end{eqnarray*}
NOW WORK
There are times when either the \(x\)-axis or the \(y\)-axis can be partitioned.
EXAMPLE 6Finding the Area Between the Graphs of Two Functions
Find the area \(A\) of the region enclosed by the graphs of \(y=\sqrt{4-4x}, y=\sqrt{4-x}\), and the \(x\)-axis:
- (a) by partitioning the \(x\)-axis.
- (b) by partitioning the \(y\)-axis.
Solution (a) We begin by graphing the two equations and identifying the region whose area we seek. See Figure 11.
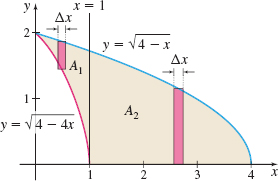
If we partition the \(x\)-axis, the area \(A\) of the region we seek must be expressed as the sum of the two areas \(A_{1}\) and \(A_{2}\) marked in the figure. [Do you see why? The bottom graph changes at \(x=1\) from \(y=\sqrt{4-4x}\) to \(y=0\) (the \(x\)-axis)].
Area \(A_{1}\) is the region enclosed by the graphs of \(y=\sqrt{4-x}\), and \(y=\sqrt{4-4x}\), and the line \(x=1\). Area \(A_{2}\) is the region enclosed by the graph \(y=\sqrt{4-x}\), the \(x\)-axis,
410
and the line \(x=1\). Then \begin{eqnarray*} A &=&A_{1}+A_{2}=\int_{0}^{1}( \sqrt{4-x}-\sqrt{4-4x})~{\it dx}+\int_{1}^{4}\sqrt{4-x}~{\it dx} \\[4pt] &=&\int_{0}^{1}\sqrt{4-x}~{\it dx}-\int_{0}^{1}\sqrt{4-4x}~{\it dx}+\int_{1}^{4}\sqrt{4-x}~{\it dx} \\[4pt] &=&\int_{0}^{4}\sqrt{4-x}~{\it dx}-\int_{0}^{1}\sqrt{4-4x}~{dx}\!\qquad {\color{#0066A7}{\hbox{$\int_{0}^{1}\sqrt{ {4-x}}{~{dx}}+\int_{1}^{4}\sqrt{{4-x}}{~{dx}}=\int_{0}^{4}\sqrt{{4-x}}{~{dx}}$}}} \end{eqnarray*}
To find the first integral, we use the substitution \(u=4-x\). Then \({\it du}=-{\it dx}\), and \begin{equation*} \int_{0}^{4}\sqrt{4-x}~{\it dx}=-\int_{4}^{0}u^{1/2}{\it du}=\int_{0}^{4}u^{1/2}~{\it du}= \left[ \dfrac{2}{3}u^{3/2}\right] _{0}^{4}=\frac{2}{3}( 8-0) = \frac{16}{3} \end{equation*}
For the other integral, we use the substitution \(u=4-4x\). Then \({\it du}=-4\,{\it dx}\), or equivalently, \({\it dx}=-\dfrac{{\it du}}{4}\), and \begin{equation*} \int_{0}^{1}\sqrt{4-4x}~{\it dx}=-\frac{1}{4}\int_{4}^{0}u^{1/2}~{\it du}=\dfrac{1}{4} \int_{0}^{4}u^{1/2}~{\it du}=\dfrac{1}{4}\left[ \dfrac{2}{3}u^{3/2}\right] _{0}^{4}= \frac{1}{6}( 8-0) =\frac{4}{3} \end{equation*}
The area \(A=\dfrac{16}{3}-\dfrac{4}{3}=4\) square units.

(b) Figure 12 shows the graphs of \(y=\sqrt{4-4x}\) and \(y=\sqrt{4-x}\) and the region whose area \(A\) we seek. Since the graphs of \(y=\sqrt{4-4x}\) and \(y=\sqrt{4-x}\) satisfy the Horizontal-line Test for \(0\leq y\leq 2\), we can express \(y=\sqrt{4-4x}\) as a function \(x=f(y)\) and \(y=\sqrt{4-x}\) as a function \(x=g(y)\). To find \(x=f(y)\), we solve \(y=\sqrt{4-4x}\) for \(x\), where \(x\geq 0\): \begin{eqnarray*} y&=&\sqrt{~4-4x} \\[4pt] y^{2}&=&4-4x \\[4pt] x&=&\dfrac{4-y^{2}}{4} \\[4pt] x&=&f(y)=1-\dfrac{y^{2}}{4} \end{eqnarray*}
To express \(y=\sqrt{4-x}\) as a function \(x=g(y)\), we solve for \(x\), where \(x\geq 0\): \begin{eqnarray*} y &=&\sqrt{~4-x} \\[4pt] y^{2} &=&4-x \\[4pt] x &=&g(y)=4-y^{2} \end{eqnarray*}
The graph of \(x=g(y)=4-y^{2}\) is to the right of the graph of \(x=f(y)=1-\dfrac{y^{2}}{4}, 0\leq y \leq 2\). So, \(g(y)\geq f(y)\). Then \begin{eqnarray*} A&=&\int_{0}^{2}[ g(y)-f(y)]\, {\it dy}=\int_{0}^{2}\left[ (4-y^{2})-\left( 1-\dfrac{y^{2}}{4}\right) \right] {\it dy}=\int_{0}^{2}\left( 3-\dfrac{3y^{2}}{4}\right) {\it dy}\\[4pt] &=&\left[ 3y-\dfrac{y^{3}}{4}\right] _{0}^{2}=6-\dfrac{8}{4}=4\hbox{ square units} \end{eqnarray*}
NOW WORK
When the graphs of functions of \(x\) form the top and bottom borders of the area, partitioning the \(x\)-axis is usually easier, provided it is easy to find the integrals. If the graphs of functions of \(y\) form the left and right borders of the area, partitioning the \(y\)-axis is usually easier, provided the integrals with respect to \(y\) are easily found. Example 7 shows that sometimes the first choice of a partition does not work.
411
EXAMPLE 7Finding the Area Under a Graph
Find the area \(A\) of the region enclosed by the graph of \(y=\ln x\), the \(x\)-axis, and the line \(x = e\).
Solution We begin by graphing \(y=\ln x\) and \(x=e\) and identifying the region whose area \(A\) we seek. See Figure 13.
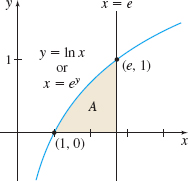
Since the graph of \(y=\ln x\) forms the top border of the area \(A\), it appears that partitioning the \(x\)-axis from \(1\) to \(e\) is easier. This leads to the integral \begin{equation*} A=\int_{1}^{e}\ln x\,{\it dx} \end{equation*}
But at this place in the text, we do not have the tools to find \(\int \ln x\,{\it dx}\).
So instead, we partition the \(y\)-axis from \(0\) to \(1\). The left graph is \(y=\ln x\) or, equivalently, \(x=e^{y}\), and the right graph is \(x=e\). Then \[ A=\int_{0}^{1}( e-e^{y}) \,{\it dy}=\big[ e y-e^{y}\big] _{0}^{1}=( e-e) -( 0-1) =1\hbox{ square unit} \]