6.3 Examination of Three-Dimensional Structure Enhances Our Understanding of Evolutionary Relationships

Sequence comparison is a powerful tool for extending our knowledge of protein function and kinship. However, biomolecules generally function as intricate three-dimensional structures rather than as linear polymers. Mutations occur at the level of sequence, but the effects of the mutations are at the level of function, and function is directly related to tertiary structure. Consequently, to gain a deeper understanding of evolutionary relationships between proteins, we must examine three-dimensional structures, especially in conjunction with sequence information. The techniques of structural determination were presented in Section 3.5.

178

Tertiary structure is more conserved than primary structure

Because three-dimensional structure is much more closely associated with function than is sequence, tertiary structure is more evolutionarily conserved than is primary structure. This conservation is apparent in the tertiary structures of the globins (Figure 6.15), which are extremely similar even though the similarity between human myoglobin and lupine leghemoglobin is just barely detectable at the sequence level (Figure 6.12) and that between human α -hemoglobin and lupine leghemoglobin is not statistically significant (15% identity). This structural similarity firmly establishes that the framework that binds the heme group and facilitates the reversible binding of oxygen has been conserved over a long evolutionary period.

Figure 6.15: Conservation of three-dimensional structure. The tertiary structures of human hemoglobin (α chain), human myoglobin, and lupine leghemoglobin are conserved. Each heme group contains an iron atom to which oxygen binds.
[Drawn from 1HBB.pdb, 1MBD.pdb, and 1GDJ.pdb.]

179

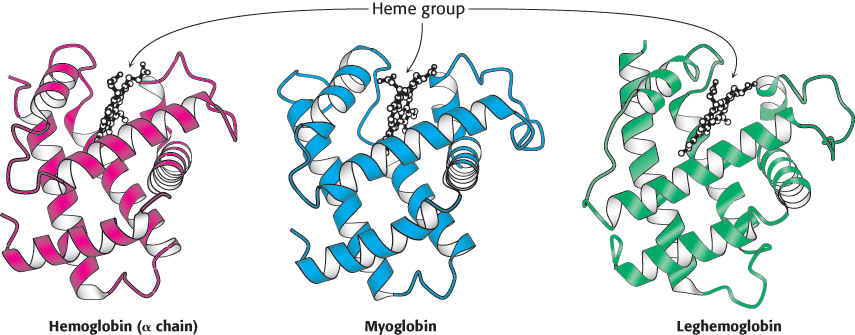
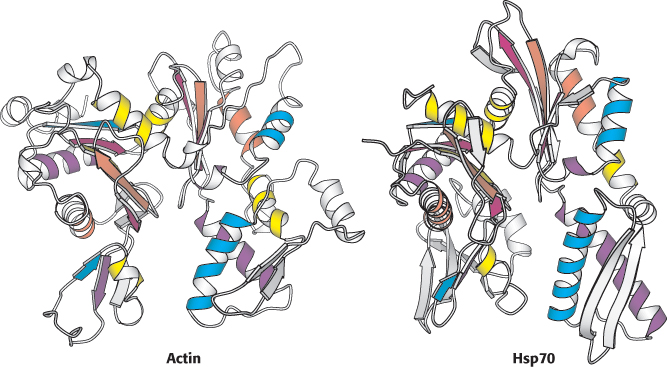
Anyone aware of the similar biochemical functions of hemoglobin, myoglobin, and leghemoglobin could expect the structural similarities. In a growing number of other cases, however, a comparison of three-dimensional structures has revealed striking similarities between proteins that were not expected to be related, on the basis of their diverse functions. A case in point is the protein actin, a major component of the cytoskeleton (Section 35.2), and heat shock protein 70 (Hsp70), which assists protein folding inside cells. These two proteins were found to be noticeably similar in structure despite only 16% sequence identity (Figure 6.16). On the basis of their three-dimensional structures, actin and Hsp70 are paralogs. The level of structural similarity strongly suggests that, despite their different biological roles in modern organisms, these proteins descended from a common ancestor. As the three-dimensional structures of more proteins are determined, such unexpected kinships are being discovered with increasing frequency. The search for such kinships relies ever more frequently on computer-based searches that are able to compare the three-dimensional structure of any protein with all other known structures.

Figure 6.16: Structures of actin and a large fragment of heat shock protein 70 (Hsp70). A comparison of the identically colored elements of secondary structure reveals the overall similarity in structure despite the difference in biochemical activities.
[Drawn from 1ATN.pdb and 1ATR.pdb.]

Knowledge of three-dimensional structures can aid in the evaluation of sequence alignments
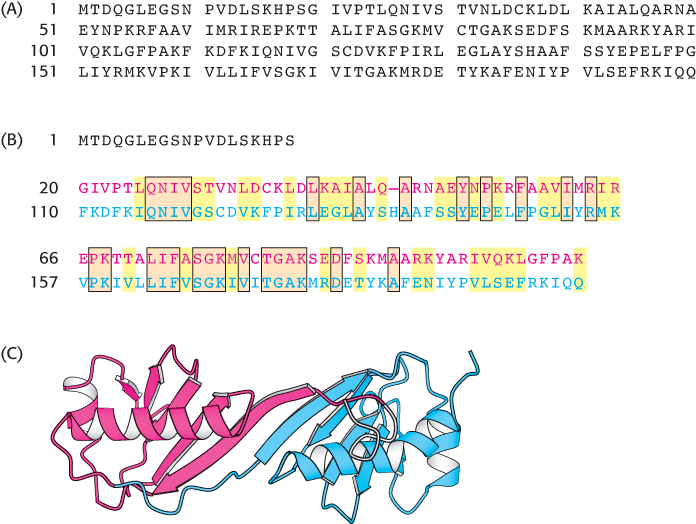
The sequence-comparison methods described thus far treat all positions within a sequence equally. However, we know from examining families of homologous proteins for which at least one three-dimensional structure is known that regions and residues critical to protein function are more strongly conserved than are other residues. For example, each type of globin contains a bound heme group with an iron atom at its center. A histidine residue that interacts directly with this iron atom (residue 64 in human myoglobin) is conserved in all globins. After we have identified key residues or highly conserved sequences within a family of proteins, we can sometimes identify other family members even when the overall level of sequence similarity is below statistical significance. Thus it may be useful to generate a sequence template—a map of conserved residues that are structurally and functionally important and are characteristic of particular families of proteins, which makes it possible to recognize new family members that might be undetectable by other means. A variety of other methods for sequence classification that take advantage of known three-dimensional structures also are being developed. Still other methods are able to identify conserved residues within a family of homologous proteins, even without a known three-dimensional structure. These methods often use substitution matrices that differ at each position within a family of aligned sequences. Such methods can often detect quite distant evolutionary relationships.

180

Repeated motifs can be detected by aligning sequences with themselves

More than 10% of all proteins contain sets of two or more domains that are similar to one another. Sequence search methods can often detect internally repeated sequences that have been characterized in other proteins. Often, however, repeated units do not correspond to previously identified domains. In these cases, their presence can be detected by attempting to align a given sequence with itself. The statistical significance of such repeats can be tested by aligning the regions in question as if these regions were sequences from separate proteins. For the TATA-box-binding protein (Figure 6.17A), a key protein in controlling gene transcription (Section 29.2), such an alignment is highly significant: 30% of the amino acids are identical over 90 residues (Figure 6.17B). The estimated probability of such an alignment occurring by chance is 1 in 1013. The determination of the three-dimensional structure of the TATA-box-binding protein confirmed the presence of repeated structures; the protein is formed of two nearly identical domains (Figure 6.17C). The evidence is convincing that the gene encoding this protein evolved by duplication of a gene encoding a single domain.

Figure 6.17: Sequence alignment of internal repeats. (A) The primary structure of the TATA-box-binding protein. (B) An alignment of the sequences of the two repeats of the TATA-box-binding protein. The amino-terminal repeat is shown in red and the carboxyl-terminal repeat in blue. (C) Structure of the TATA-box-binding protein. The amino-terminal domain is shown in red and the carboxyl-terminal domain in blue.
[Drawn from 1VOK.pdb.]

181

Convergent evolution illustrates common solutions to biochemical challenges

Thus far, we have been exploring proteins derived from common ancestors—that is, through divergent evolution. Other cases have been found of proteins that are structurally similar in important ways but are not descended from a common ancestor. How might two unrelated proteins come to resemble each other structurally? Two proteins evolving independently may have converged on similar structural features to perform a similar biochemical activity. Perhaps that structure was an especially effective solution to a biochemical problem that organisms face. The process by which very different evolutionary pathways lead to the same solution is called convergent evolution.

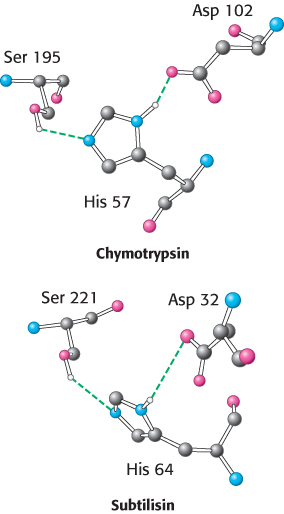
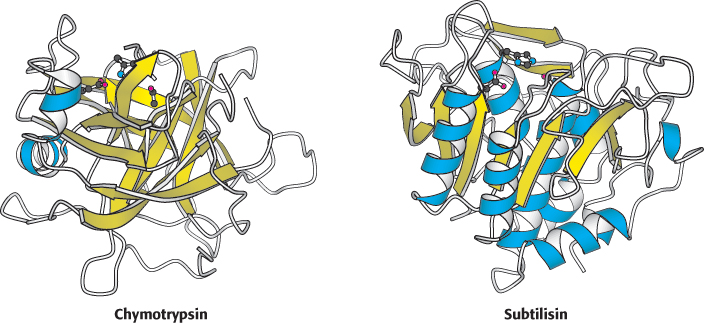
An example of convergent evolution is found among the serine proteases. These enzymes, to be considered in more detail in Chapter 9, cleave peptide bonds by hydrolysis. Figure 6.18 shows the structure of the active sites—that is, the sites on the proteins at which the hydrolysis reaction takes place—for two such enzymes, chymotrypsin and subtilisin. These active-site structures are remarkably similar. In each case, a serine residue, a histidine residue, and an aspartic acid residue are positioned in space in nearly identical arrangements. As we will see, this conserved spatial arrangement is critical for the activity of these enzymes and affords the same mechanistic solution to the problem of peptide hydrolysis. At first glance, this similarity might suggest that these proteins are homologous. However, striking differences in the overall structures of these proteins make an evolutionary relationship extremely unlikely (Figure 6.19). Whereas chymotrypsin consists almost entirely of β sheets, subtilisin contains extensive α-helical structure. Moreover, the key serine, histidine, and aspartic acid residues do not occupy similar positions or even appear in the same order within the two sequences. It is extremely unlikely that two proteins evolving from a common ancestor could have retained similar active-site structures while other aspects of the structure changed so dramatically.

Figure 6.18: Convergent evolution of protease active sites. The relative positions of the three key residues shown are nearly identical in the active sites of the serine proteases chymotrypsin and subtilisin.
Figure 6.19: Structures of mammalian chymotrypsin and bacterial subtilisin. The overall structures are quite dissimilar, in stark contrast with the active sites, shown at the top of each structure. The β strands are shown in yellow and the α helices in blue.
[Drawn from 1GCT.pdb. and 1SUP.pdb.]

182

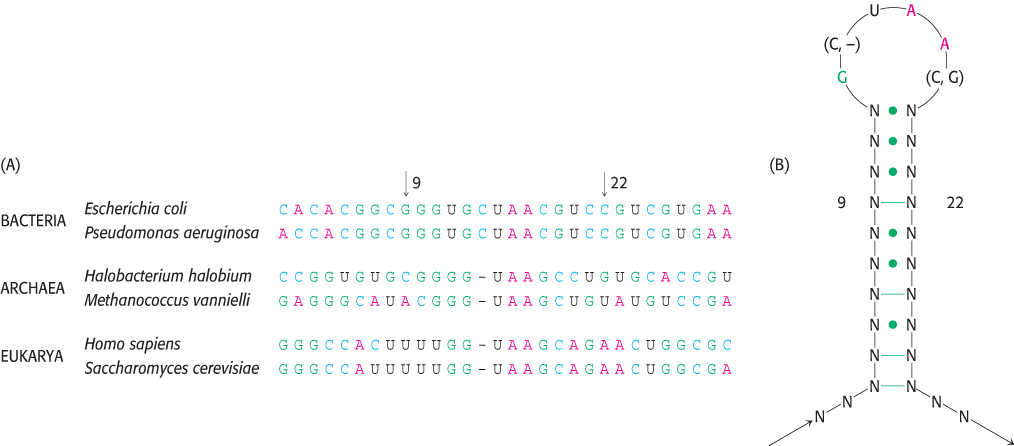
Comparison of RNA sequences can be a source of insight into RNA secondary structures

Homologous RNA sequences can be compared in a manner similar to that already described for protein sequences. Such comparisons can be a source of important insights into evolutionary relationships; in addition, they provide clues to the three-dimensional structure of the RNA itself. As noted in Chapter 4, single-stranded nucleic acid molecules fold back on themselves to form elaborate structures held together by Watson–Crick base-pairing and other interactions. In a family of sequences that form similar base-paired structures, base sequences may vary, but base-pairing ability is conserved. Consider, for example, a region from a large RNA molecule present in the ribosomes of all organisms (Figure 6.20). In the region shown, the E. coli sequence has a guanine (G) residue in position 9 and a cytosine (C) residue in position 22, whereas the human sequence has uracil (U) in position 9 and adenine (A) in position 22. Examination of the six sequences shown in Figure 6.20 reveals that the bases in positions 9 and 22, as well as several of the neighboring positions, retain the ability to form Watson–Crick base pairs even though the identities of the bases in these positions vary. We can deduce that two segments with paired mutations that maintain base-pairing ability are likely to form a double helix. Where sequences are known for several homologous RNA molecules, this type of sequence analysis can often suggest complete secondary structures as well as some additional interactions. For this particular ribosomal RNA, the subsequent determination of its three-dimensional structure (Section 30.3) confirmed the predicted secondary structure.

Figure 6.20: Comparison of RNA sequences. (A) A comparison of sequences in a part of ribosomal RNA taken from a variety of species. (B) The implied secondary structure. Green lines indicate positions at which Watson–Crick base-pairing is completely conserved in the sequences shown, whereas dots indicate positions at which Watson–Crick base-pairing is conserved in most cases.

183