7-2 Measuring the Brain’s Electrical Activity
The brain is always electrically active, even when we sleep. Electrical measures of brain activity are important for studying brain function, for medical diagnosis, and for monitoring the effectiveness of therapies used to treat brain disorders. The four major techniques for tracking the brain’s electrical activity are single-
Figure 4-11 diagrams a cell membrane at rest, Figure 4-13 during graded potentials, and Figure 4-15 generating the action potential.
In part, these techniques are used to record electrical activity from different parts of neurons. The electrical behavior of cell bodies and dendrites, which give rise to graded potentials, tends to be much more varied and slower than that of axons, which conduct action potentials.
Recording Action Potentials from Single Cells
Figure 4-6 illustrates the structure and use of microelectrodes.
By the early 1950s it was becoming possible to record the activity of individual cells by measuring a single neuron’s action potentials with fine electrodes inserted into the brain. These microelectrodes can be placed next to cells (extracellular recording) or inside cells (intracellular recording). Modern extracellular recording techniques make it possible to distinguish the activity of as many as 40 neurons at once. Intracellular recording allows direct study and recording of a single neuron’s electrical activity. The two disadvantages of inserting an electrode into a cell are (1) it can kill the cell, and (2) it cannot be done in awake, freely moving animals. Single-
See, for example, Seeing Shape and Seeing Color in Section 9-4 and Processing Language in Section 10-4.
We now know that cells recorded extracellularly in the brain’s sensory regions are highly specific to what excites them. Some cells in the visual system fire vigorously to specific wavelengths of light (a color) or to specific orientations of bars of light (vertical, for example). Other cells respond to more complex patterns, such as faces or hands. Similarly, cells in the auditory system respond to specific sound frequencies (a low or high pitch) or to more complex sound combinations, such as speech (the syllable ba, for example).
Section 13-4 discusses how place cells help to store memories.
But certain cells have a far more complex nature that reveals much about brain–
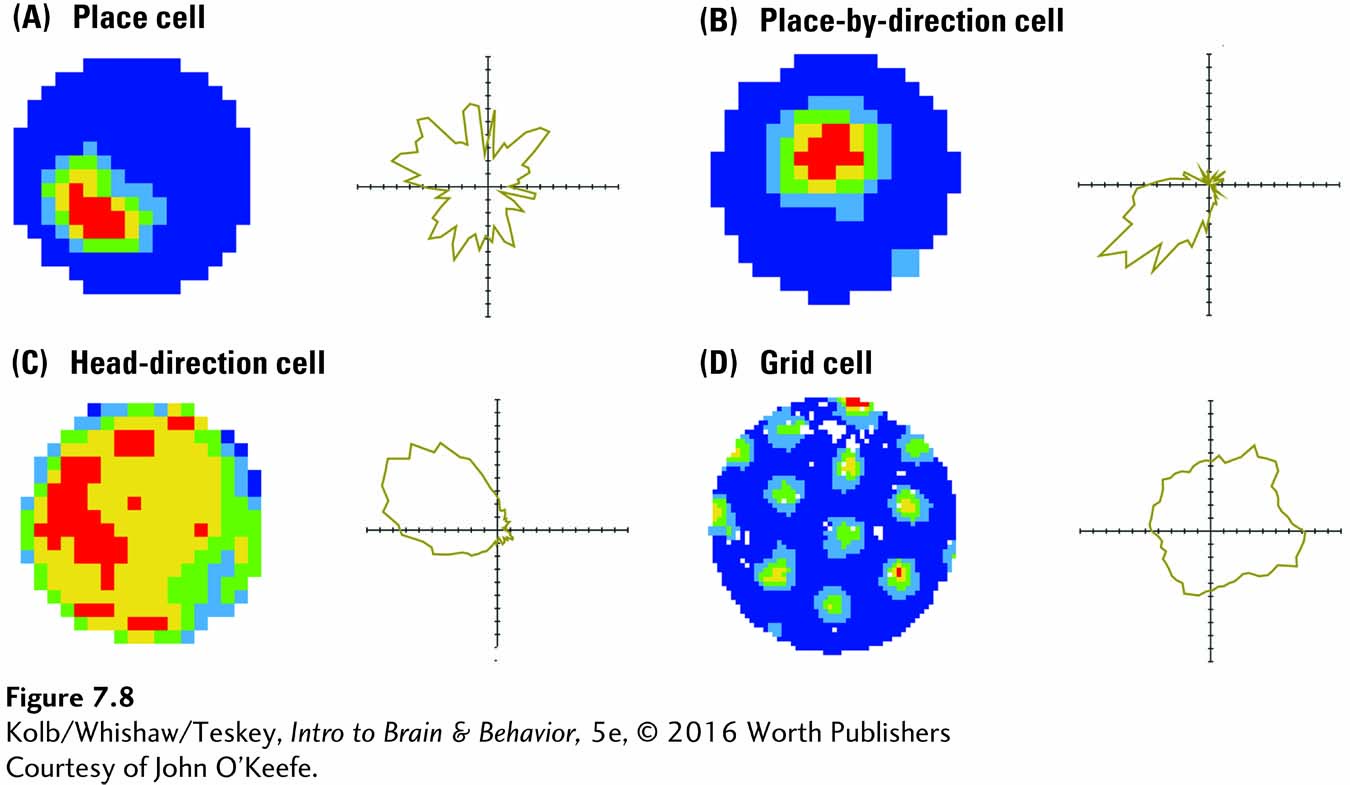
O’Keefe’s group (Cacucci et al., 2008) also demonstrated that, in mice with a genetically engineered mutation that produces deficits in spatial memory, place cells lack specificity: the cells fire to a very broad region of their world. As a result, these mice have difficulty finding their way around, much as human patients with dementia tend to get lost. One reason may be that a change, similar to the engineered mutation in mice, takes place in human brain cells.
EEG: Recording Graded Potentials from Thousands of Cells
In the early 1930s, Hans Berger discovered that the brain’s electrical activity could be recorded simply by placing electrodes on the scalp. In Berger’s words, recording these “brain waves” produces an “electrical record from the head”—an electroencephalogram. The EEG measures the summed graded potentials from many thousands of neurons. EEG waves, shown in Figure 7-9, are recorded by computer. In electrocorticography, or ECoG, a method used during neurosurgery, electrodes are placed directly on the cerebral cortex.
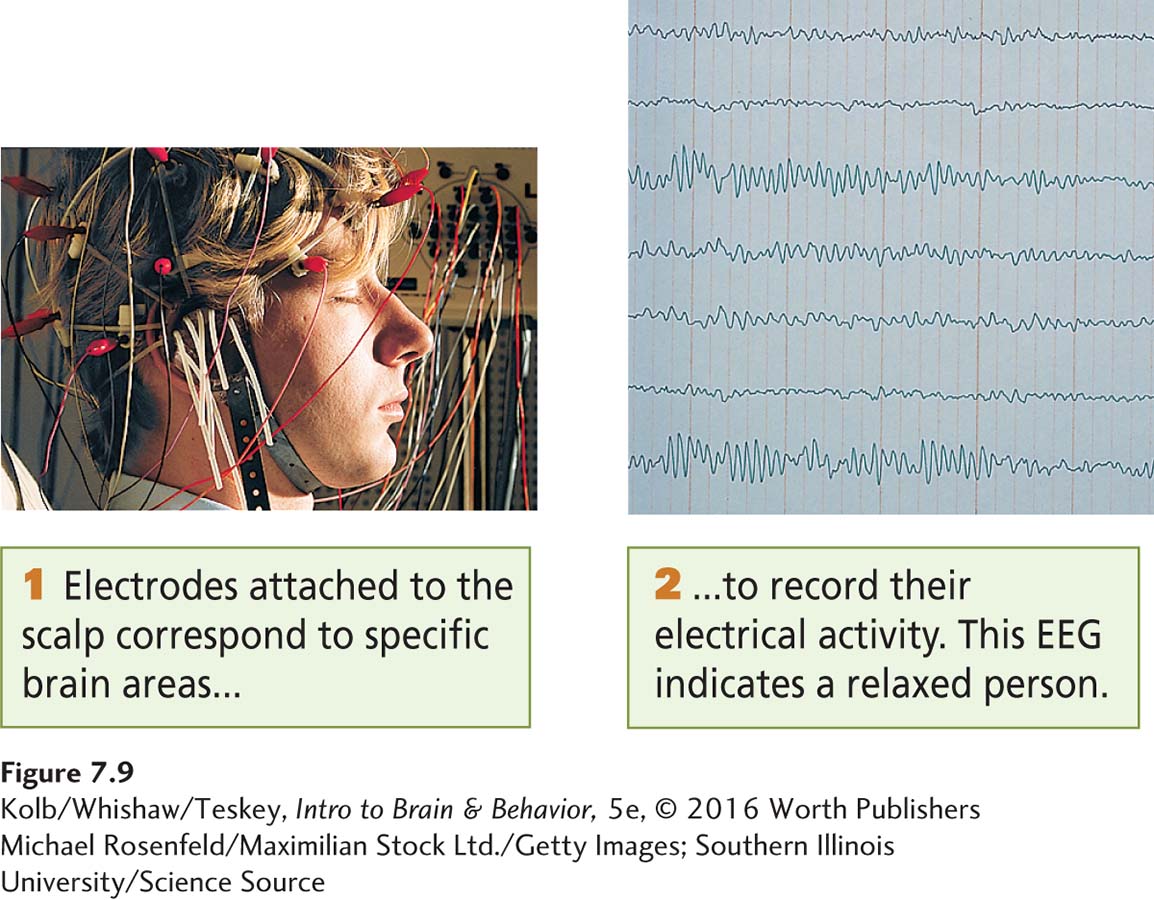
Southern Illinois University/Science Source
EEGs reveal some remarkable features of the brain’s electrical activity. The EEG recordings in Figure 7-10 illustrate three:
EEG changes as behavior changes.
An EEG recorded from the cortex displays an array of patterns, some rhythmical.
The living brain’s electrical activity is never silent, even when a person is asleep or comatose.
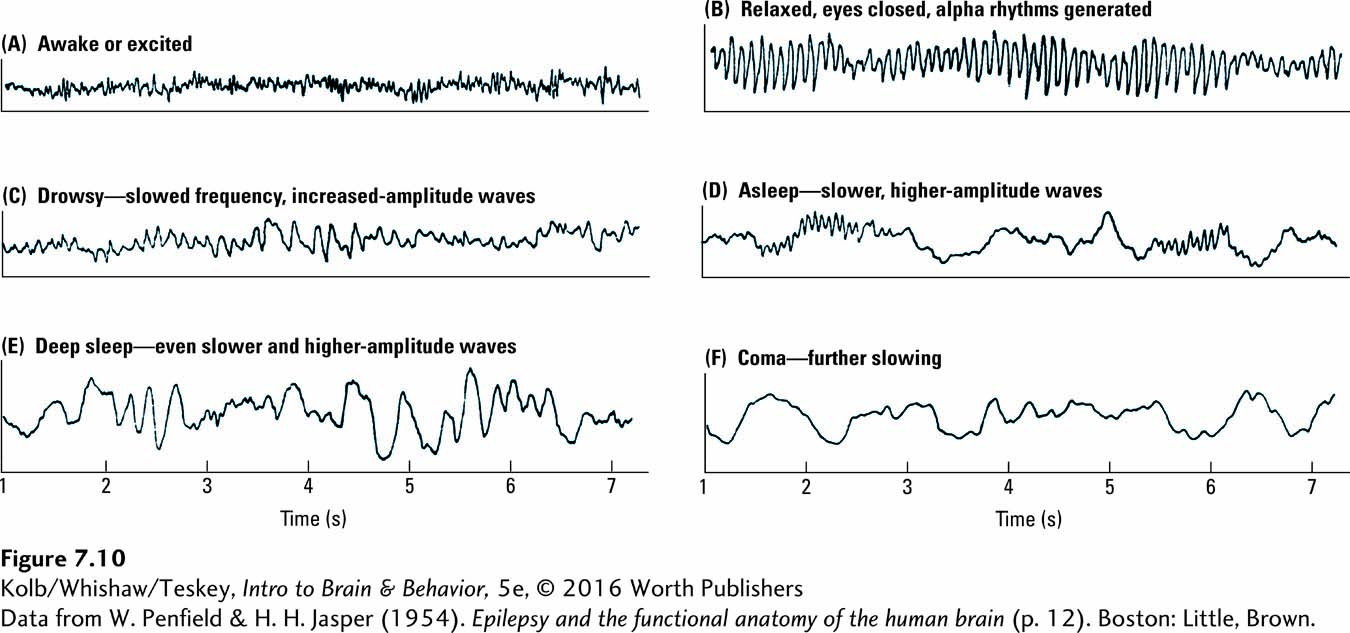
When a person is aroused, excited, or even just alert, the EEG pattern has a low amplitude and a fast frequency, as shown in Figure 7-10A. This pattern is typical of an EEG taken from anywhere on the skull of an alert subject, not only humans but other animals too. In contrast, when a participant is calm and quietly relaxed, especially with eyes closed, the rhythmical brain waves shown in Figure 7-10B often emerge. These alpha rhythms are extremely regular, with a frequency of approximately 11 cycles per second and amplitudes that wax and wane as the pattern is recorded. In humans, alpha rhythms are generated in the region of the visual cortex at the back of the brain. If a relaxed person is disturbed, performs mental arithmetic, or opens his or her eyes, the alpha rhythms abruptly stop.
Amplitude is a recorded brain wave’s height. Frequency is the number of brain waves recorded per second.
EEG is a sensitive indicator of behaviors beyond simple arousal and relaxation. Parts C, D, and E of Figure 7-10 illustrate EEG changes as a person moves from drowsiness to sleep and finally into deep sleep. EEG rhythms become progressively slower and larger in amplitude. Still slower waves appear during anesthesia, after brain trauma, or when a person is in a coma (shown in Figure 7-10F). Only in brain death does the EEG permanently become a flat line.
Section 13-3 describes how EEG measures sleep and dreaming. Focus features 4-1 and 10-3 detail epilepsy diagnoses and Section 16-3, treatments.
These distinctive brain wave patterns make EEG a reliable tool for monitoring sleep stages, estimating the depth of anesthesia, evaluating the severity of head injury, and searching for brain abnormalities. In epilepsy, for example, brief periods of impaired awareness or responsiveness and involuntary movements associated with spiking patterns in the EEG characterize electrographic seizures.
The important point here is that EEG recording provides a useful tool both for research and for diagnosing brain dysfunction. EEG can also be used in combination with the brain-
Mapping Brain Function with Event-Related Potentials
Brief changes in an EEG signal in response to a discrete sensory stimulus produce complex electroencephalographic waveforms called event-
ERPs are mixed in with so many other electrical signals in the brain that they are difficult to spot just by visually inspecting an EEG record. One way to detect ERPs is to produce the stimulus repeatedly and average the recorded responses. Averaging tends to cancel out any irregular and unrelated electrical activity, leaving in the EEG record only the potentials the stimulus generated.
To clarify this procedure, imagine throwing a small stone into a lake of choppy water. Although the stone produces a splash, the splash is hard to see among all the ripples and waves. Like the splash surrounded by choppy water, the ERP caused by a sensory stimulus is hard to discern from all the other electrical activity around it.
A solution is to throw a number of stones exactly the same size, always hitting the same spot in the water, and producing the same splash over and over. If a computer then calculates an average of the water’s activity, random wave movements will tend to average one another out, and you will see the splashes produced by the stones as clearly as a single stone thrown into a pool of calm water.
Figure 7-11. This ERP pattern consists of a number of negative (N) and positive (P) waves that occur within a few hundred milliseconds after the stimulus.
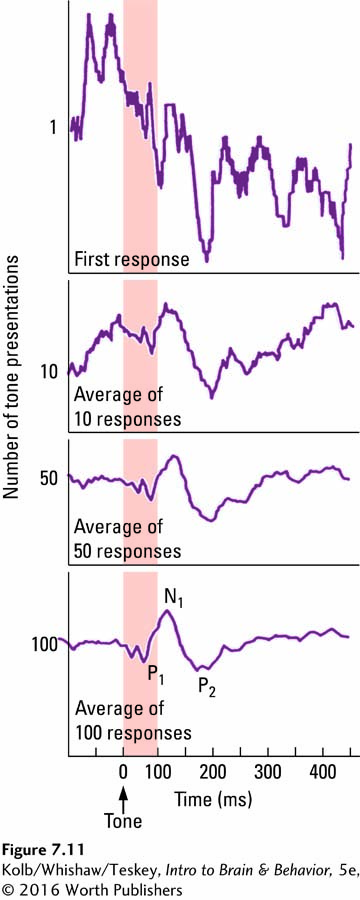
The waves are numbered in time sequence. For instance, in Figure 7-11, N1 is a negative wave occurring about 100 milliseconds after the stimulus, whereas P2 is a positive wave occurring about 200 milliseconds after the stimulus. (The waves may also be labeled as N100 and P200.) Not all these waves are unique to this particular stimulus. Some are common to any auditory stimulus. Other waves, however, correspond to important differences in specific tone. ERPs to spoken words even contain distinctive peaks and patterns that differentiate such similar-
7-2
Mild Head Injury and Depression
When a pallet of boxed tools tipped and part of the load struck his head, B. D., an industrial tool salesman, did not lose consciousness. He did sustain a serious cut to his scalp and damage to two spinal vertebrae. The attending physician at the hospital emergency room suspected mild concussion but ordered no further neurological workup at the time.
B. D.’s spinal symptoms gradually cleared, but irritability, anxiety, and depression persisted even 2 years later. B. D. was unable to work, and his behavioral change placed a major strain on his family. His emotional problems led him to withdraw from the world, only worsening his predicament.
A neuropsychological exam administered to B. D. about 2 years after the injury found his general cognitive ability to be well above average, with an IQ score of 115. But B. D. also had significant attentional and short-
One tool for investigating brain functioning in such cases is ERP. Reza and colleagues (2007) compared healthy controls to groups of subjects with mild head injuries, with or without depression. The investigators found that all subjects with head injury displayed a delayed P3 wave, but only those who were depressed as well also had a delayed N2 wave. These findings demonstrate that ERP can identify cerebral processing abnormalities in people with depression after mild head injury, even when MRI scans are negative. Such evidence can be critical for people like B. D., who are seeking long-
Among the many practical reasons for using ERPs to study the brain is the advantage that this EEG technique is noninvasive. Electrodes are placed on the scalp, not in the brain. Therefore, ERPs can be used to study humans, including those most frequently used participants: college students.
Another advantage is cost. Compared to other techniques, such as brain imaging, EEG and ERP are inexpensive and can be recorded from many brain areas simultaneously by pasting an array of electrodes (sometimes more than 200) to different parts of the scalp. Because certain brain areas respond only to certain sensory stimuli (e.g., auditory areas respond to sounds and visual areas to sights), relative responses at different locations can be used to map brain function.
Figure 7-12 shows a multiple-
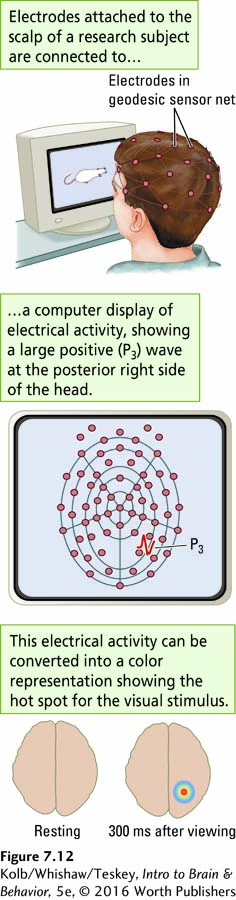
ERPs not only can detect which brain areas are processing particular stimuli but also can be used to study the order in which different regions participate. This second use of ERPs is important because we want to know the route that information takes as it travels through the brain. In Figure 7-12, the participant is viewing a picture of a rat that appears repeatedly in the same place on a computer screen. The P3 recorded from the posterior right side of the head is larger than any other P3 occurring elsewhere, meaning that this region is a hot spot for processing the visual stimulus. Presumably, this particular participant’s right posterior brain is central in decoding the picture of the rat 300 milliseconds after it is presented.
Many other interesting research areas benefit from using ERPs, as described in Clinical Focus 7-2, Mild Head Injury and Depression. ERPs also can be used to study how children learn and process information differently as they mature. ERPs can examine how a person with a brain injury compensates for the impairment by using undamaged brain regions. ERPs can even help reveal which brain areas are most sensitive to aging and therefore contribute most to declining behavioral functions among the elderly. This simple, inexpensive research tool can address all these areas.
Magnetoencephalography
Passing a magnetic field across a wire induces an electrical current in the wire. Conversely, current flowing along a wire induces a magnetic field around the wire. The same is true in the brain. Neural activity, by generating an electrical field, also produces a magnetic field. Although the magnetic field produced by a single neuron is vanishingly small, the field produced by many neurons is sufficiently strong to be recorded on the scalp. The record of this phenomenon, a magnetoencephalogram (MEG), is the magnetic counterpart of the EEG or ERP.
Calculations based on MEG measurements not only describe neuronal groups’ electrical activity but also localize the cell groups generating the measured field in three dimensions. Magnetic waves conducted through living tissue undergo less distortion than electrical signals do, so an MEG can yield a higher resolution than an ERP. A major advantage of the MEG over the EEG and ERP, then, is MEG’s ability to more precisely identify the source of the activity being recorded. For example, MEG has proved useful in locating the source of epileptic discharges. MEG’s disadvantage is its high cost in comparison with the apparatus used to produce EEGs and ERPs.
7-2 REVIEW
Measuring the Brain’s Electrical Activity
Before you continue, check your understanding.
Question 1
The four major techniques for tracking the brain’s electrical activity are_________,_________, _________, and _________.
Question 2
Single-
Question 3
EEG measures _________ on the cell membrane.
Question 4
Magnetoencephalography measures the _________ and also provides a _________.
Question 5
What is the advantage of EEG techniques over MEG?
Answers appear in the Self Test section of the book.