26-6 Galaxies and the first stars formed from density fluctuations in the early universe
The distribution of matter in the universe today is quite lumpy. Stars are grouped together in galaxies, galaxies into clusters, and clusters into superclusters that stretch across 50 Mpc (150 million ly) or more (see Section 23-6). Furthermore, galaxies seem to be concentrated along enormous sheets, which in turn surround voids measuring 30 to 120 Mpc (100 million to 400 million ly) across. Figure 23-23 and Figure 23-24 show these features, which characterize the large-scale structure of the universe. How did this large-scale structure arise from the chaos of the primordial fireball? When did stars first appear in the universe? And when and how did galaxies first form?
Density Fluctuations and the Jeans Length
At first glance the origin of large-scale structure seems puzzling, because the early universe must have been exceedingly smooth. To see why, think back to the era of recombination that occurred 380,000 years after the Big Bang (see Section 25-5). Before recombination, high-energy photons were constantly and vigorously colliding with charged particles throughout all space. After recombination, the universe became transparent, and these photons stopped interacting with the matter in the universe. Astronomers say that matter “decoupled” from radiation during the era of recombination. Because the cosmic microwave background is extremely isotropic, we can conclude that the matter with which these photons once collided so frequently must also have been spread smoothly across space.
The distribution of matter during the early universe could not have been perfectly uniform, however. If it had been, it would still have to be absolutely uniform today; there would now be only a few atoms per cubic meter of space, with no stars and no galaxies. Consequently, there must have been slight lumpiness, or density fluctuations, in the distribution of matter in the early universe. These fluctuations are thought to have originated in the very early universe, even before the inflationary epoch. Infinitesimally small quantum fluctuations in density, which are required by the Heisenberg uncertainty principle (see Section 26-3), were stretched during inflation to appreciable size. Through the action of gravity, these fluctuations initiated the clumping that eventually grew to become the galaxies and clusters of galaxies that we see today throughout the universe. As we saw in Section 25-5 and Section 25-8, the pattern of density fluctuations became imprinted on the cosmic background radiation during the era of recombination. Figure 25-13 shows a map of these fluctuations obtained from the WMAP microwave background spacecraft.
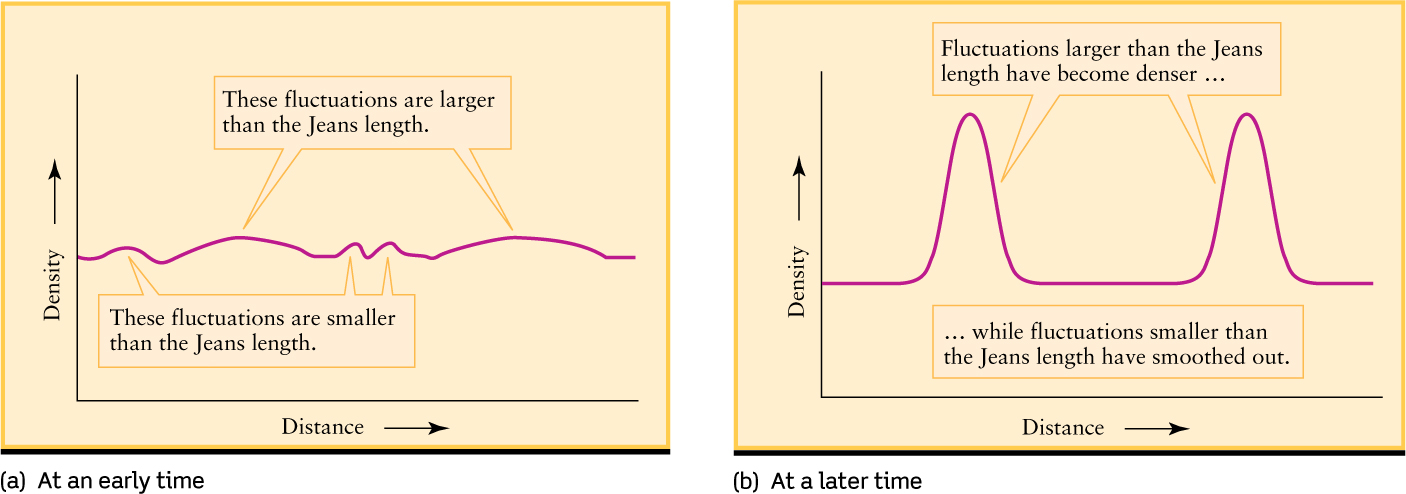
Our understanding of how gravity can amplify density fluctuations dates back to 1902, when the British physicist James Jeans solved a problem first proposed by Isaac Newton. Suppose that you have a gas with only very tiny fluctuations in density, as shown in Figure 26-16a. These regions of higher density will then gravitationally attract nearby material and thus gain mass. As the regions become more massive, however, the pressure of the gas inside these regions will also increase, which can make these regions expand and disperse. Jeans analyzed these opposing effects and asked the question: Under what conditions does gravity overwhelm gas pressure so that a permanent object can form?
Jeans proved that an object will grow due to a density fluctuation provided that the fluctuation extends over a distance that exceeds the so-called Jeans length (LJ):
Jeans length for density fluctuations
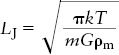
- LJ = Jeans length
- k = Boltzmann constant = 1.38 × 10⁻²³ J/K
- T = temperature of the gas (in kelvins)
- m = mass of a single particle in the gas (in kilograms)
- G = universal constant of gravitation = 6.67 × 10⁻¹¹ N · m2/kg2
- ρm = average density of matter in the gas
Density fluctuations that extend across a distance larger than the Jeans length tend to grow, while fluctuations smaller than LJ tend to disappear (Figure 26-16b).
We can apply the Jeans formula to the conditions that prevailed during the era of recombination, when T = 3000 K and ρm = 10−18 kg/m3. Taking m to be the mass of the hydrogen atom (m = 1.67 × 10⁻²⁷ kg), we find that LJ = 100 light-years, the diameter of a typical globular cluster (Figure 26-17). Furthermore, the mass contained in a cube whose sides are 1 Jeans length in size (equal to the product of the density, ρm, and the volume of the cube, LJ3) is about 5 × 10⁵ M⊙, equal to the mass of a typical globular cluster. These calculations suggest that globular clusters were among the first objects to form after recombination.
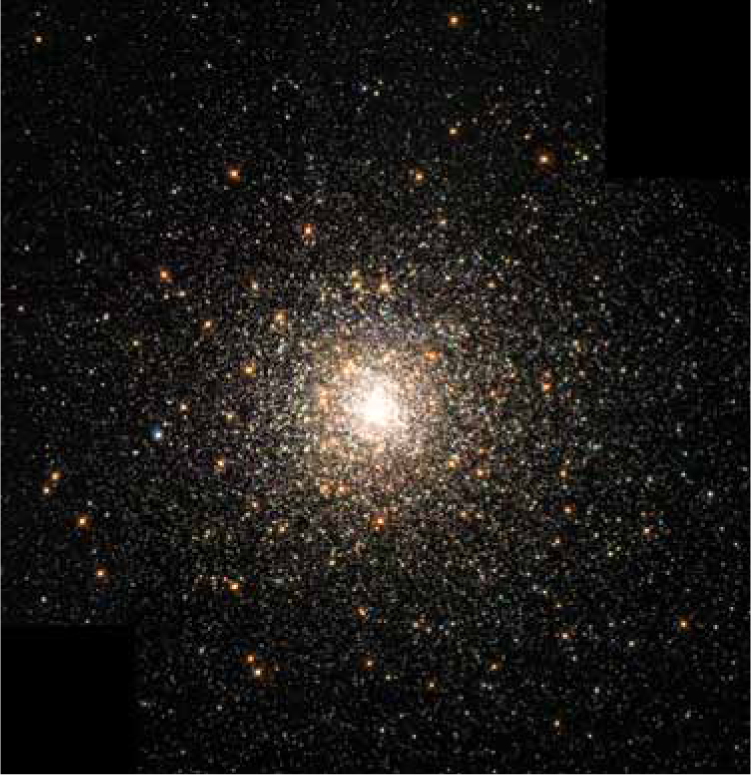
A Globular Cluster A Globular Cluster A typical globular cluster contains 105 to 106 stars, each with an average mass of about 1 M⊙, so the total mass of a typical cluster is 105−106 M⊙. Cluster diameters range from about 6 to 120 pc (20 to 400 ly). Because these masses and diameters are comparable to the Jeans length (LJ) during the era of recombination, astronomers suspect that globular clusters were among the first objects to form in the universe.
CONCEPT CHECK 26-10
Consider a density fluctuation around the era of recombination when the universe had a temperature of T = 3000 K. If the density fluctuation is about 10 light-years across, will the matter within that fluctuation begin clumping together? What causes or prevents clumping?
A clump of matter will not form. When the universe reaches T = 3000 K, the Jeans length is LJ = 100 light-years. Fluctuations shorter in length will not contract into clumps because there is not enough gravitational attraction to overwhelm the increased pressure that clumping would produce.
Population III Stars: The “Zeroth” Generation
We saw in Section 19-4 that globular clusters contain the most ancient stars we can find in the present-day universe. These are Population II stars with a low percentage of metals (elements heaver than hydrogen and helium), and are of an earlier stellar generation than metal-rich Population I stars like the Sun (see Section 19-5). However, the Population II stars in globular clusters cannot be the very first stars to have formed after the Big Bang. Those first stars could have contained only hydrogen, helium, and tiny amounts of lithium and beryllium; as Figure 26-15 shows, these were the only elements whose nuclei formed in the early universe. Hence, these original stars would have contained an even smaller percentage of metals than the Population II stars found in globular clusters. Such “zeroth-generation” stars are called Population III stars.
The “zeroth generation” of stars were much more massive and luminous than stars today
 Like stars in the present-day universe, Population III stars would have formed from clouds of gas. These ancient gas clouds were composed almost exclusively of hydrogen and helium atoms, and such clouds have higher internal pressures than do metal-rich clouds of the same temperature. A star can form only when the mutual gravitation of the various parts of a cloud (which tends to make the cloud collapse) overcomes the internal pressure of the cloud (which tends to prevent collapse). Hence, Population III stars could form only if their mass (and hence their mutual gravitation) was rather large. Calculations suggest that these stars had masses from 30 to 1000 M⊙, compared to the range of 0.4 to roughly 120 M⊙ for modern stars. Even the smallest Population III star would rank among the largest stars observed today.
Although no Population III stars have yet been observed directly, we have at least indirect evidence that they existed. Infrared images from the Spitzer Space Telescope like the one that opens this chapter reveal a distant infrared background of starlight that is what we would expect to see from these zeroth-generation stars.
Another bit of evidence follows from the tremendous energy output of these stars: A 1000-M⊙ Population III star would have been millions of times more luminous than the Sun and have a surface temperature in excess of 105 K, causing it to emit a flood of short-wavelength, high-energy photons. The photons from even a small number of such stars would have ionized most of the atoms in the universe, leaving electrons and nuclei of hydrogen and helium. This process is called reionization, a name that reminds us the universe had previously been ionized prior to recombination at t = 380,000 years. We saw in Section 25-8 that the photons of the cosmic microwave background are scattered by free electrons, and the effects of this scattering can be detected in maps of the background radiation. Data from the WMAP spacecraft suggest that reionization took place around 400 million years after the Big Bang, which in turn suggests that Population III stars formed around that time.
Since Population III stars were all very massive, their lifetimes were short and none could have survived to the present day. But during their short lifetimes, thermonuclear reactions within these stars produced elements heavier than beryllium for the first time in the history of the universe. What’s more, calculations suggest that when these stars exploded—and due to their great mass, all of them did—they did not leave a white dwarf, neutron star, or black hole behind. Instead, all of their mass was ejected into space to be incorporated into the next generation of stars. The presence of heavy elements in the ejected material meant that when this material subsequently formed into clouds, the internal pressure of these clouds was lowered substantially and it became possible for low-mass stars to form. This laid the foundation for today’s universe, in which dim, low-mass stars are common and luminous, massive stars are the exception (see Figure 17-5).
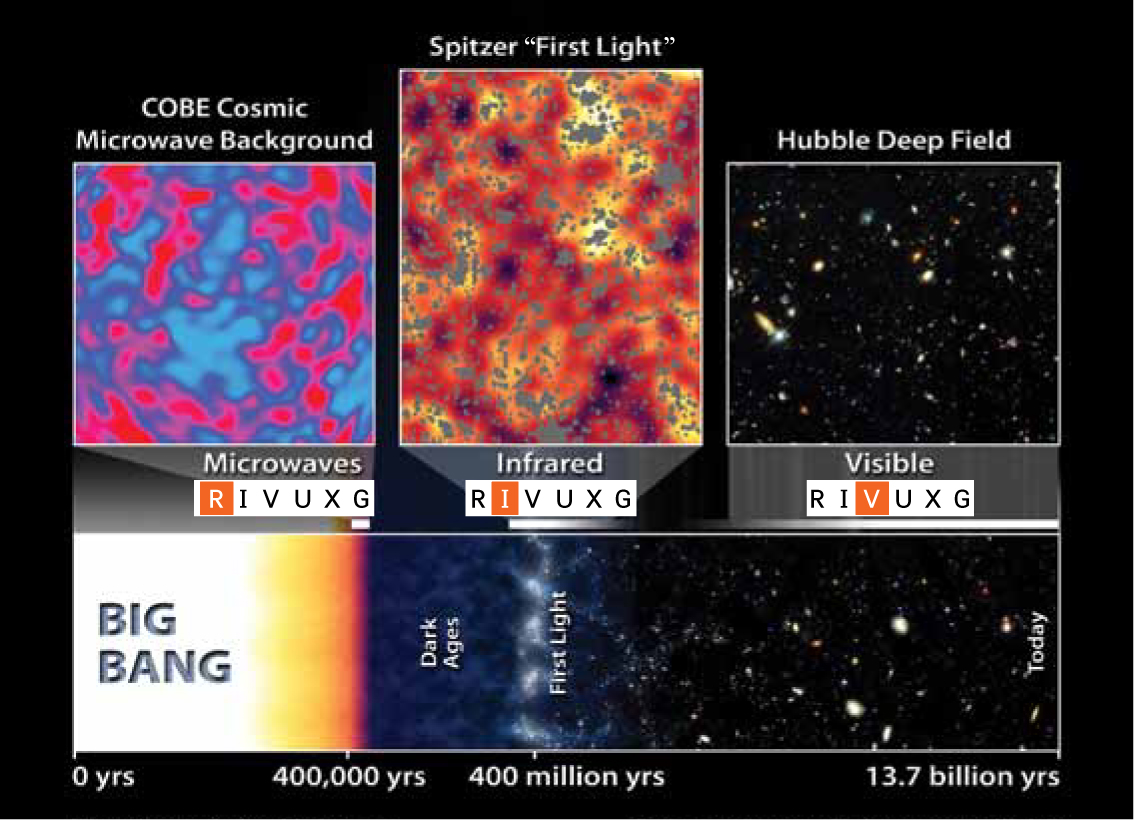
The era from recombination at t = 380,000 years to the first stars at t = 400 million years is called the dark ages. The only photons present at that time were those that make up today’s cosmic background radiation. The dark ages ended when the universe was filled for the first time with the light from stars (Figure 26-18).
Forming Large-Scale Structure
Once clumps the size of globular clusters had formed in the universe, how did they form into galaxies, clusters of galaxies, and larger structures? One issue that complicates this matter is the presence of dark energy, which acts to accelerate the expansion of the universe (see Section 25-6). This accelerated expansion pulls clumps of material away from each other and makes it more difficult for them to coalesce into larger structures. Another complication is that about 85% of the mass in the universe is in the form of dark matter, whose nature is not known (see Section 23-8). Researchers have hypothesized different types of dark matter in the hope of explaining the large-scale structure that we see. Neutrinos are an example of hot dark matter, so named because it consists of light-weight particles traveling at high speeds. Cold dark matter, on the other hand, consists of massive particles traveling at slow speeds. Examples include WIMPs (which we discussed in Section 22-4) as well as other exotic, speculative particles.
Scientists use supercomputer simulations to see how different types of dark matter would influence the development of large-scale structure. Figure 26-19 shows the results of such a simulation for a flat universe with dark energy and cold dark matter. The simulation follows the motions of 2 million particles of cold dark matter in a box that expands as the universe expands. The box at the lower right of the figure, representing the present time (redshift z = 0) is 43 Mpc (160 million ly) a side. At earlier times, the box represents a volume whose side is smaller by a factor 1/(1 + z). For example, each side of the box for z = 0.99 is actually 1/1.99 as long as the box for z = 0.
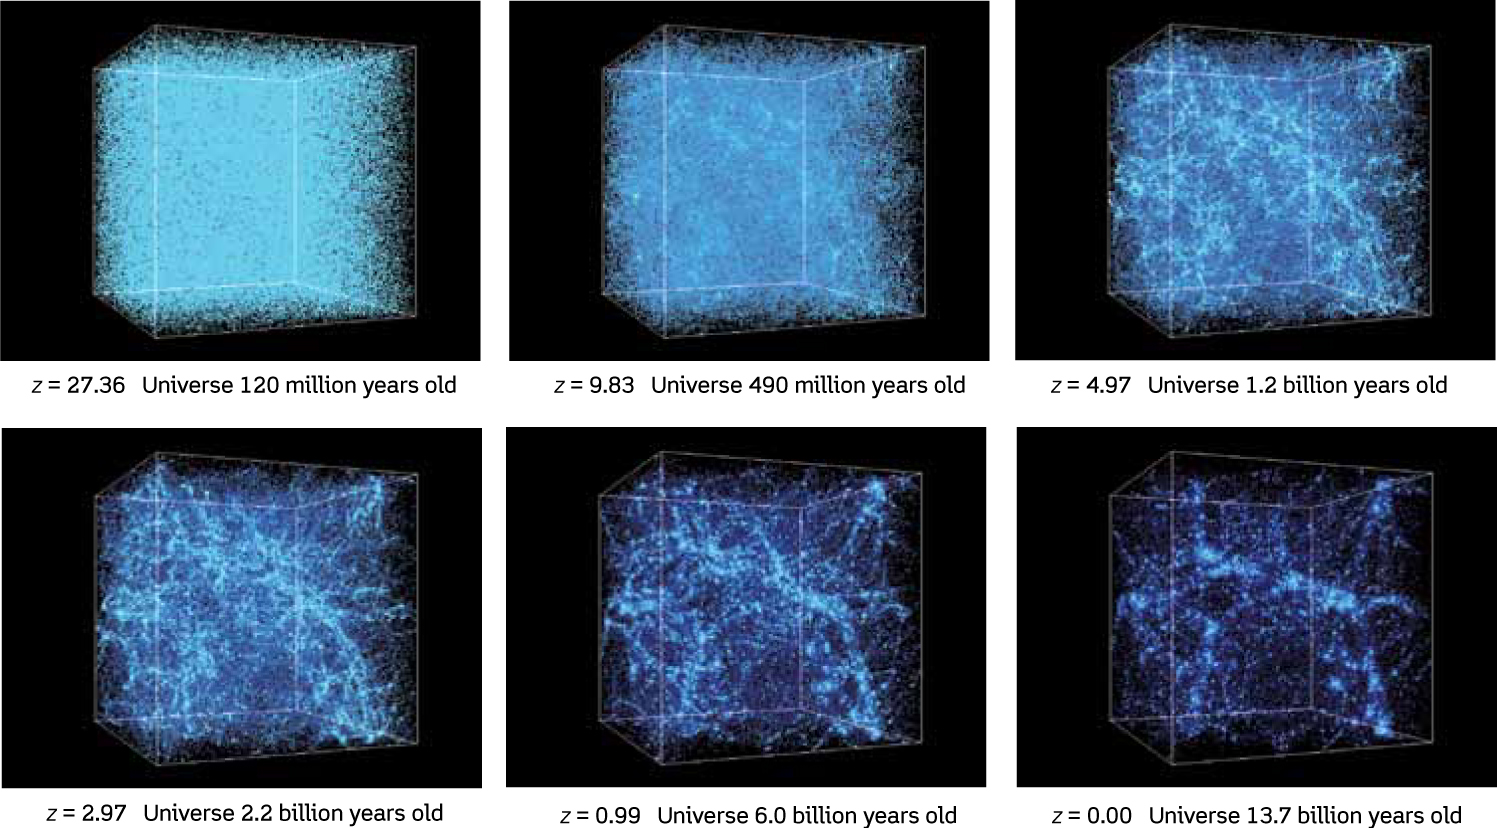

 A Cold Dark Matter Simulation with Dark Energy These six views show the evolution of dark matter particles in a large, box-shaped volume of space. The box actually expands with time to follow the expansion of the universe and holds the same number of particles. In this figure, the boxes have been rescaled so they all appear at the same size. Small fluctuations in density are put into the simulation at the beginning (at upper left); these evolve over time to form structures that resemble those actually observed in our present-day universe (z = 0.00, shown at the lower right).
The simulation begins 120 million years after the Big Bang with an almost perfectly uniform distribution of particles, mimicking the tiny density fluctuations that must have been present just after inflation. A supercomputer then calculates how these particles move, based on Newton’s laws in an expanding universe. As time goes on, the fluctuations grow into small, bright clumps whose sizes and masses are similar to those of galaxies. A large filament also forms, spanning the entire box from left to right. The simulation shows that no additional structures formed after the universe was about 6 billion years old, corresponding to redshift z = 1. The explanation is that after this time, the accelerating expansion of the universe becomes more important than gravitational attraction. The final frame of the simulation strongly resembles actual maps of galaxies in our present-day universe (see Figure 23-24).
Simulations similar to those in Figure 26-19 have also been carried out using hot dark matter in the form of neutrinos. A massless neutrino would always travel at the speed of light, just as a photon does. However, experiments show that neutrinos do have a small mass. (This nonzero mass is what allows one type of neutrino to transform into another. We saw in Section 16-4 that such transformations provided the explanation to the long-standing solar neutrino problem.) Hence, neutrinos travel slower than light, and slow down as the universe expands and cools. Slow-moving neutrinos would accumulate over time within density fluctuations, and the gravitational pull of these neutrinos on surrounding matter could eventually lead to the formation of clusters of galaxies.
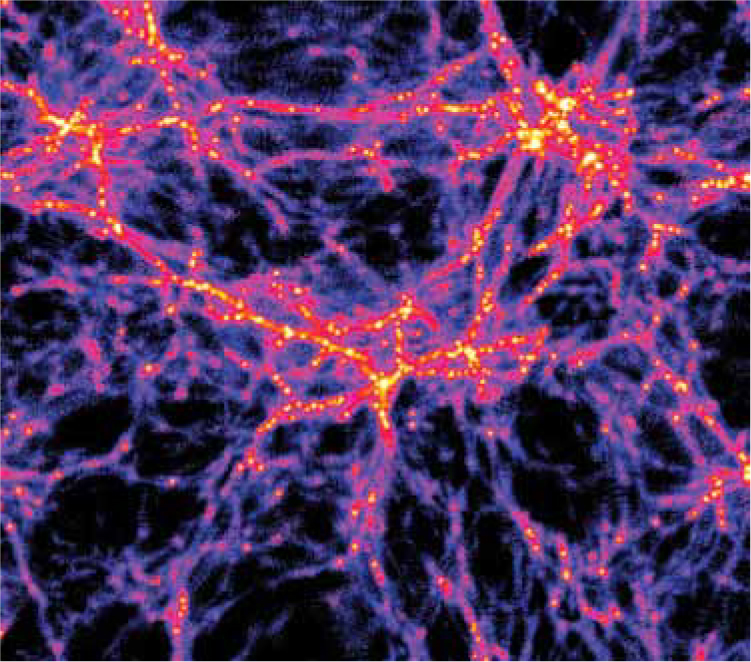
A primary difference between simulations based on cold and hot dark matter is the way in which galaxies form. In calculations based on cold dark matter, the formation of galaxies takes place from the “bottom up.” In these simulations, the densest gas undergoes collapse early in the history of the universe and stars begin to form. The regions of star formation stream along the filaments (Figure 26-20). When they meet at the intersections between filaments, they merge and group together into galaxies, then clusters of galaxies, then superclusters. But in calculations based on hot dark matter, galaxies form from the “top down.” Huge superclustersized sheets of matter form first and then fragment into galaxies. Observations of remote galaxies show that galaxies actually formed from the “bottom up” scenario. One piece of evidence for this is the image in Figure 26-21a, which shows a handful of “galaxy building blocks” at z = 3.04 (when the universe was 2.2 billion years old). These “building blocks,” which have not yet coalesced into galaxies, lie within a long filament (see Figure 26-21b) that resembles those shown in the simulation of Figure 26-20. Figure 26-22 shows a collection of “building blocks” at a later stage in the process of merging into a galaxy. These observations strongly suggest that the dominant form of dark matter is cold, not hot.
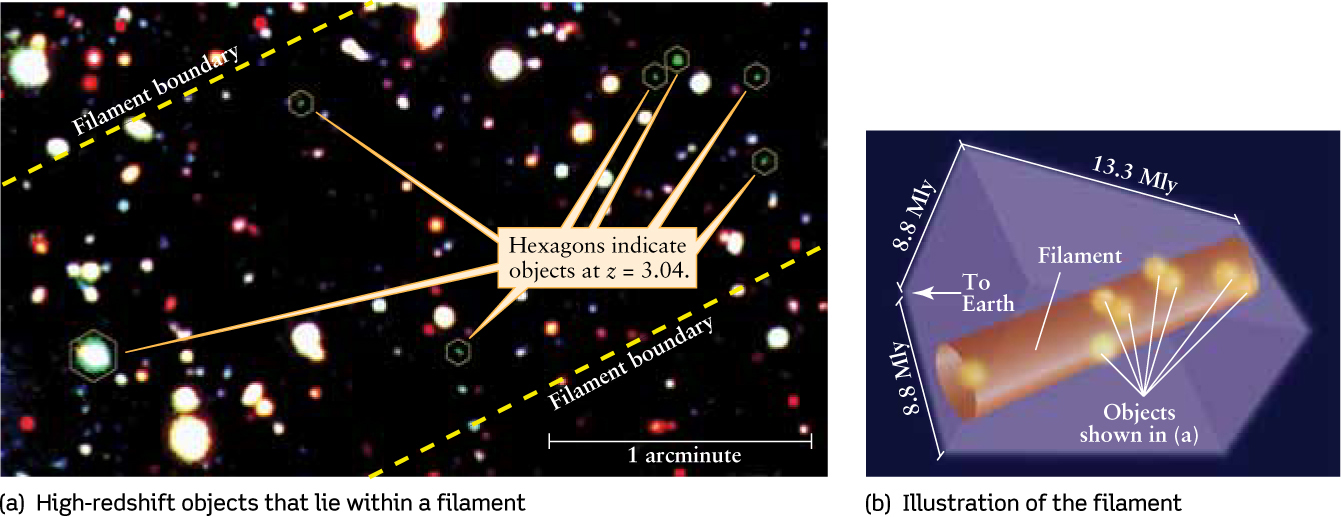
“Bottom-Up” Galaxy Formation: Observation (a) The hexagons in this image from the Very Large Telescope show the positions of a number of sub-galaxy-sized objects at a redshift z = 3.04, the same as in the simulation shown in Figure 26-20. Excited hydrogen atoms in these objects emit ultraviolet photons, which are redshifted to visible wavelengths. This redshifted emission gives these objects a characteristic green color. (The object at lower left actually lies in front of a much brighter quasar.) (b) The objects in (a) all lie within an immense filament. The purple box shows the volume of space studied in this observing program. The dimensions are given in millions of light-years (Mly).
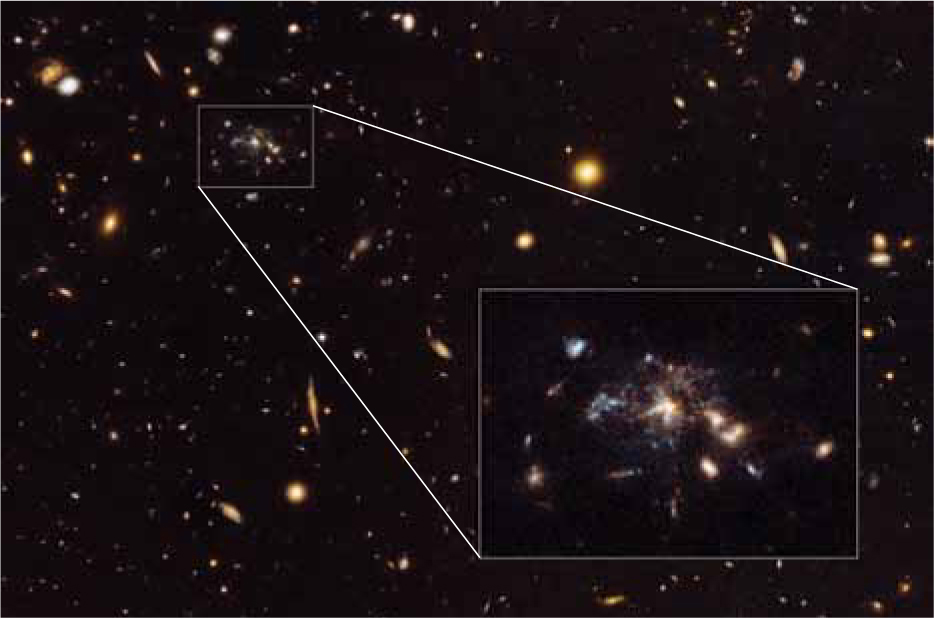
A Galaxy Under Construction This Hubble Space Telescope image shows dozens of small galaxies in the process of merging into a single large galaxy. We see this galaxy at a redshift z = 2.2, corresponding to a time 3.1 billion years after the Big Bang.
What Large-Scale Structure Reveals
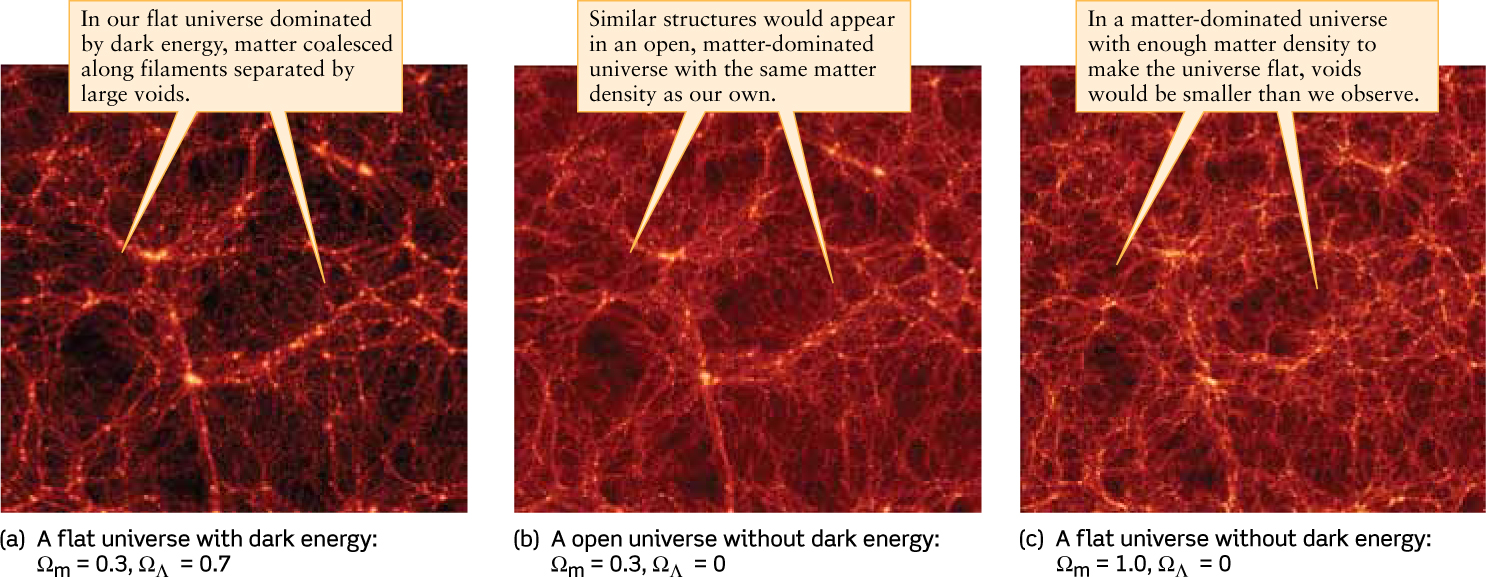
How might the universe have evolved if it had contained different amounts of cold dark matter and dark energy? Figure 26-23 shows some simulations designed to explore these possibilities. If the density of matter in the universe is kept constant for various simulations, the simulations predict approximately the same structure for different values of the dark energy density parameter ΩΛ defined in Section 25-6 (see Figure 26-23a and Figure 26-23b). But if too large a matter density is used in the simulation, the voids between galaxies are smaller than what we actually observe in our universe (Figure 26-23c). Hence, observations of galaxy clustering coupled with supercomputer simulations of galaxy formation help determine the matter density of our universe. (We made use of this idea in Section 25-7. The brown band in Figure 25-18 shows the constraints on cosmological parameters from these observations and simulations of galaxies.)
The best match to the observed distribution of galaxy clusters and to the cosmic background radiation data (see Figure 25-22) is a model like that shown in Figure 26-19, with dark energy and cold dark matter in the proportions listed in Table 25-2.
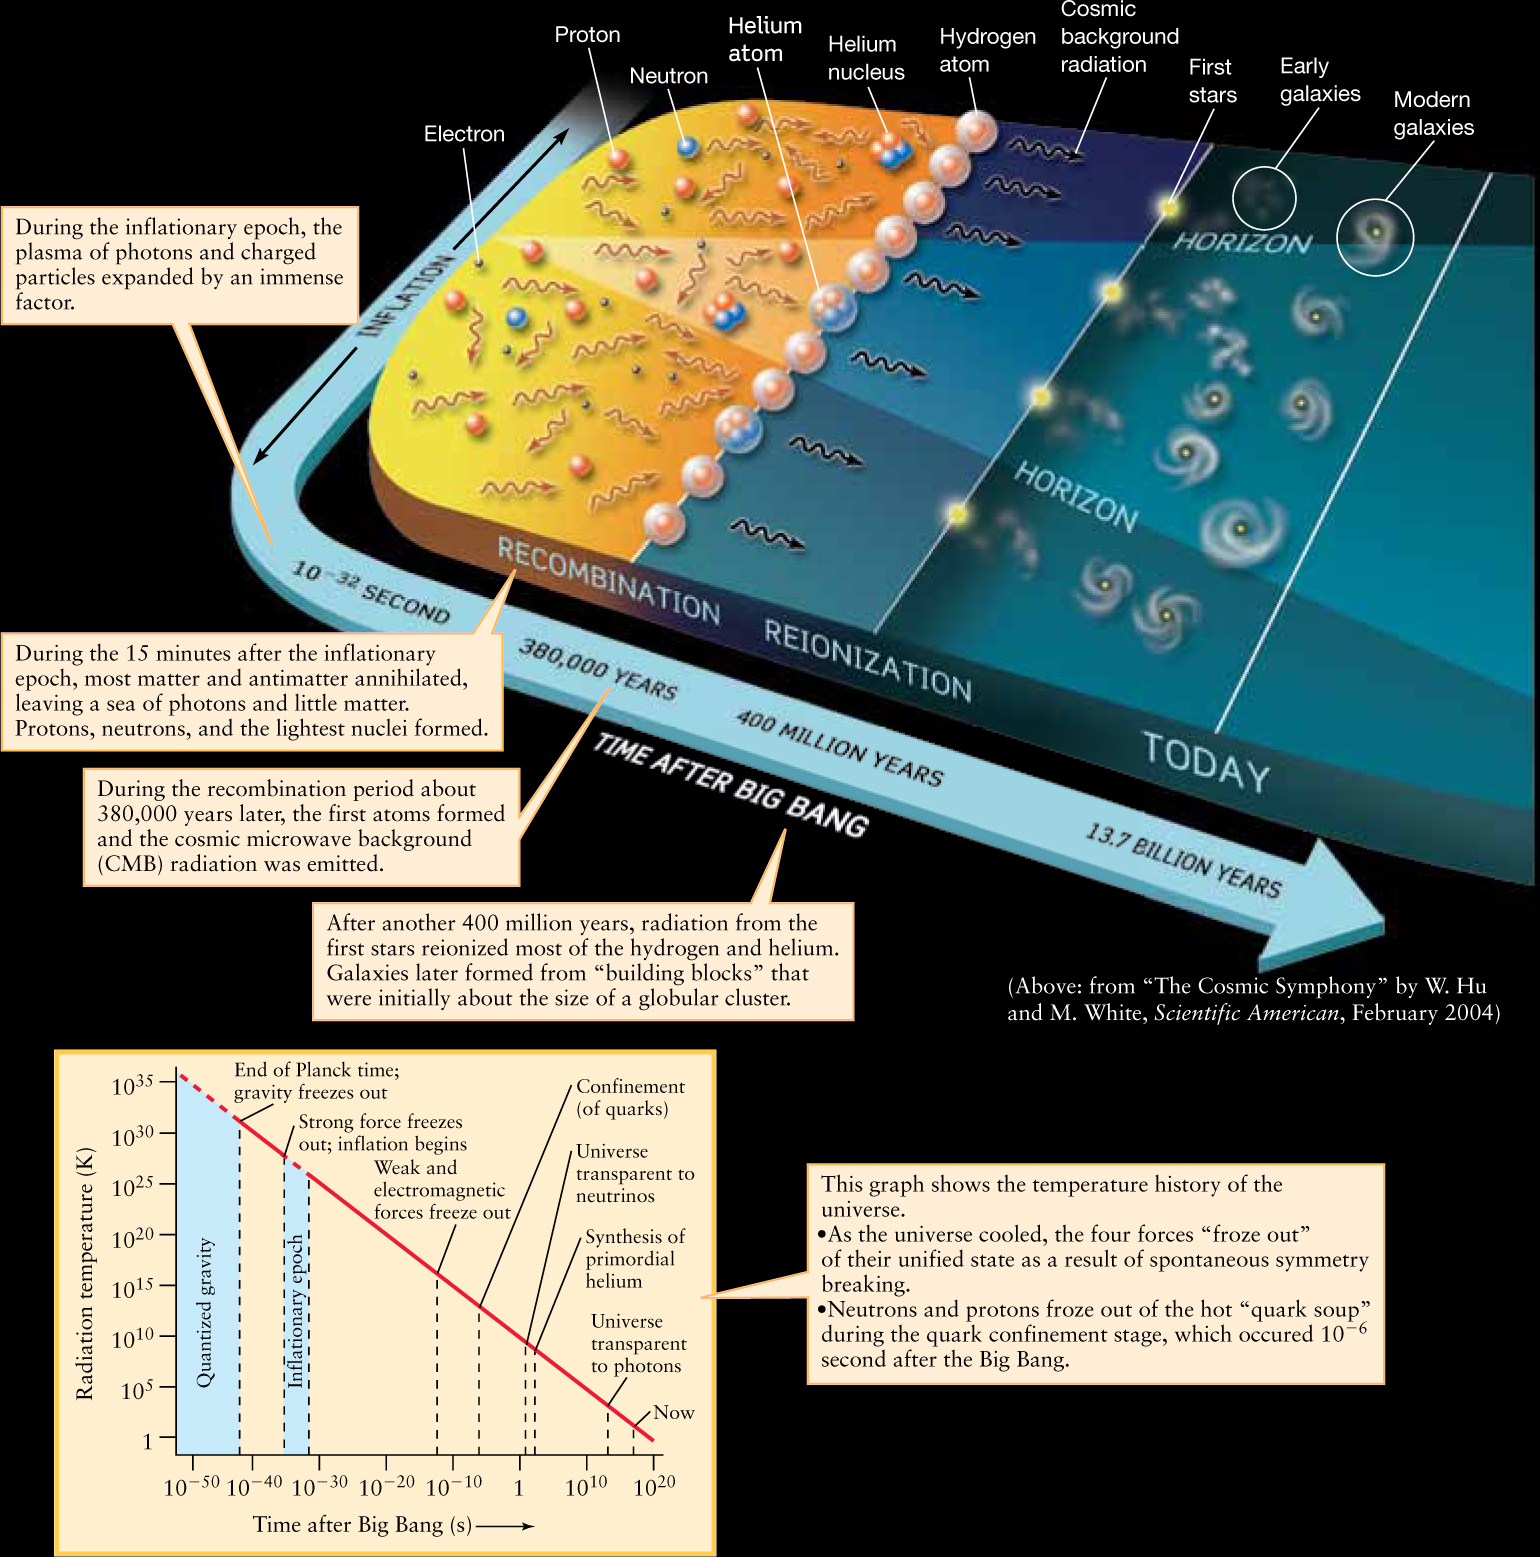
Cosmic Connections: The History of the Universe summarizes the past history of our universe down to the present day. As we discussed in Section 25-7, the future of our universe is less certain and depends on the detailed character of dark energy. More detailed data about galaxy clusters and the cosmic background radiation will be needed to pin down the future evolution of our universe.
COSMIC CONNECTIONS
The History of the Universe
Research in astronomy, elementary particle physics, and nuclear physics has allowed scientists to piece together the grand sweep of events over the first billion years of cosmic history. The greatest drama occurred in the first few minutes, and these graphs have been drawn to emphasize those earliest moments.
CONCEPT CHECK 26-11
How does structure formation in the early universe provide clues to the nature of dark matter?
Cold dark matter particles (which are heavier and move at lower speeds) lead to “bottom up” formation, which is what we observe. Hot dark matter, such as neutrinos, leads to “top down” formation, which is not supported by observations.