8.4The Michaelis–Menten Model Accounts for the Kinetic Properties of Many Enzymes
The Michaelis–Menten Model Accounts for the Kinetic Properties of Many Enzymes
The study of the rates of chemical reactions is called kinetics,and the study of the rates of enzyme-
Kinetics is the study of reaction rates
What do we mean when we say the “rate” of a chemical reaction? Consider a simple reaction:

The rate V is the quantity of A that disappears in a specified unit of time. It is equal to the rate of the appearance of P, or the quantity of P that appears in a specified unit of time.

If A is yellow and P is colorless, we can follow the decrease in the concentration of A by measuring the decrease in the intensity of yellow color with time. Consider only the change in the concentration of A for now. The rate of the reaction is directly related to the concentration of A by a proportionality constant, k, called the rate constant.

Reactions that are directly proportional to the reactant concentration are called first-
Many important biochemical reactions include two reactants. For example,

or

226
They are called bimolecular reactions and the corresponding rate equations often take the form

and

The rate constants, called second-
Sometimes, second-
Interestingly enough, under some conditions, a reaction can be zero order. In these cases, the rate is independent of reactant concentrations. Enzyme-
The steady-state assumption facilitates a description of enzyme kinetics
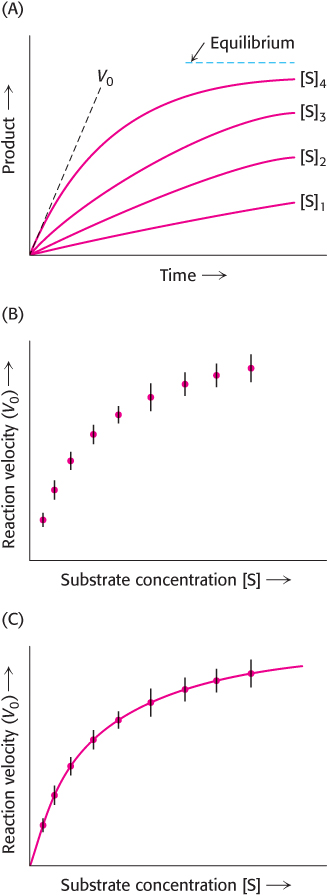
The simplest way to investigate the reaction rate is to follow the increase in reaction product as a function of time. First, the extent of product formation is determined as a function of time for a series of substrate concentrations (Figure 8.10A). As expected, in each case, the amount of product formed increases with time, although eventually a time is reached when there is no net change in the concentration of S or P. The enzyme is still actively converting substrate into product and vice versa, but the reaction equilibrium has been attained. However, enzyme kinetics is more readily comprehended if we consider only the forward reaction. We can define the rate of catalysis V0, or the initial rate of catalysis, as the number of moles of product formed per second when the reaction is just beginning—

In 1913, Leonor Michaelis and Maud Menten proposed a simple model to account for these kinetic characteristics. The critical feature in their treatment is that a specific ES complex is a necessary intermediate in catalysis. The model proposed is

An enzyme E combines with substrate S to form an ES complex, with a rate constant k1. The ES complex has two possible fates. It can dissociate to E and S, with a rate constant k−1, or it can proceed to form product P, with a rate constant k2. The ES complex can also be reformed from E and P by the reverse reaction with a rate constant k−2. However, as before, we can simplify these reactions by considering the rate of reaction at times close to zero (hence, V0) when there is negligible product formation and thus no back reaction (k−2 [E][P] ≈ 0).

227
Thus, for the graph in Figure 8.11, V0 is determined for each substrate concentration by measuring the rate of product formation at early times before P accumulates (Figure 8.10A).

We want an expression that relates the rate of catalysis to the concentrations of substrate and enzyme and the rates of the individual steps. Our starting point is that the catalytic rate is equal to the product of the concentration of the ES complex and k2.

Now we need to express [ES] in terms of known quantities. The rates of formation and breakdown of ES are given by


We will use the steady-

By rearranging equation 16, we obtain

Equation 17 can be simplified by defining a new constant, KM, called the Michaelis constant:

Note that KM has the units of concentration and is independent of enzyme and substrate concentrations. As will be explained, KM is an important characteristic of enzyme–
Inserting equation 18 into equation 17 and solving for [ES] yields

Now let us examine the numerator of equation 19. Because the substrate is usually present at a much higher concentration than that of the enzyme, the concentration of uncombined substrate [S] is very nearly equal to the total substrate concentration. The concentration of uncombined enzyme [E] is equal to the total enzyme concentration [E]T minus the concentration of the ES complex:

Substituting this expression for [E] in equation 19 gives

Solving equation 21 for [ES] gives

228
or

By substituting this expression for [ES] into equation 13, we obtain

The maximal rate, Vmax, is attained when the catalytic sites on the enzyme are saturated with substrate—

Substituting equation 25 into equation 24 yields the Michaelis–

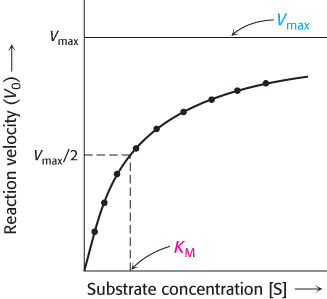
This equation accounts for the kinetic data given in Figure 8.11. At very low substrate concentration, when [S] is much less than KM, V0 = (Vmax/KM) [S]; that is, the reaction is first order with the rate directly proportional to the substrate concentration. At high substrate concentration, when [S] is much greater than KM, V0 = Vmax; that is, the rate is maximal. The reaction is zero order, independent of substrate concentration.
The significance of KM is clear when we set [S] = KM in equation 26. When [S] = KM, then V0 = Vmax/2. Thus, KM is equal to the substrate concentration at which the reaction rate is half its maximal value. As we will see, KM is an important characteristic of an enzyme-
Variations in KM can have physiological consequences
 The physiological consequence of KM is illustrated by the sensitivity of some persons to ethanol. Such persons exhibit facial flushing and rapid heart rate (tachycardia) after ingesting even small amounts of alcohol. In the liver, alcohol dehydrogenase converts ethanol into acetaldehyde.

Normally, the acetaldehyde, which is the cause of the symptoms when present at high concentrations, is processed to acetate by aldehyde dehydrogenase.

Most people have two forms of the aldehyde dehydrogenase, a low KM mitochondrial form and a high KM cytoplasmic form. In susceptible persons, the mitochondrial enzyme is less active owing to the substitution of a single amino acid, and acetaldehyde is processed only by the cytoplasmic enzyme. Because this enzyme has a high KM, it achieves a high rate of catalysis only at very high concentrations of acetaldehyde. Consequently, less acetaldehyde is converted into acetate; excess acetaldehyde escapes into the blood and accounts for the physiological effects.
KM and Vmax values can be determined by several means

KM is equal to the substrate concentration that yields Vmax/2; however Vmax, like perfection, is only approached but never attained. How, then, can we experimentally determine KM and Vmax, and how do these parameters enhance our understanding of enzyme-
229
Before the availability of computers, the determination of KM and Vmax values required algebraic manipulation of the Michaelis–

A plot of 1/V0 versus 1/[S], called a Lineweaver–
KM and Vmax values are important enzyme characteristics
The KM values of enzymes range widely (Table 8.4). For most enzymes, KM lies between 10−1 and 10−7 M. The KM value for an enzyme depends on the particular substrate and on environmental conditions such as pH, temperature, and ionic strength. The Michaelis constant, KM, as already noted, is equal to the concentration of substrate at which half the active sites are filled. Thus, KM provides a measure of the substrate concentration required for significant catalysis to take place. For many enzymes, experimental evidence suggests that the KM value provides an approximation of the substrate concentration in vivo, which in turn suggests that most enzymes evolved to have a KM approximately equal to the substrate concentration commonly available. Why might it be beneficial to have a KM value approximately equal to the commonly available substrate concentration? If the normal concentration of substrate is near KM, the enzyme will display significant activity and yet the activity will be sensitive to changes in environmental conditions—
|
Enzyme |
Substrate |
KM (μM) |
|---|---|---|
|
Chymotrypsin |
Acetyl- |
5000 |
|
Lysozyme |
Hexa- |
6 |
|
β-Galactosidase |
Lactose |
4000 |
|
Threonine deaminase |
Threonine |
5000 |
|
Carbonic anhydrase |
CO2 |
8000 |
|
Penicillinase |
Benzylpenicillin |
50 |
|
Pyruvate carboxylase |
Pyruvate HCO_3 ATP |
400 1000 60 |
|
Arginine- |
Arginine tRNA ATP |
3 0.4 300 |
Under certain circumstances, KM reflects the strength of the enzyme–

Equation 28 describes the dissociation constant of the ES complex.

230
In other words, KM is equal to the dissociation constant of the ES complex if k2 is much smaller than k−1. When this condition is met, KM is a measure of the strength of the ES complex: a high KM indicates weak binding; a low KM indicates strong binding. It must be stressed that KM indicates the affinity of the ES complex only when k−1 is much greater than k2.
The maximal rate, Vmax, reveals the turnover number of an enzyme, which is the number of substrate molecules converted into product by an enzyme molecule in a unit time when the enzyme is fully saturated with substrate. It is equal to the rate constant k2, which is also called kcat. The maximal rate, Vmax, reveals the turnover number of an enzyme if the concentration of active sites [E]T is known, because

and thus

For example, a 10−6 M solution of carbonic anhydrase catalyzes the formation of 0.6 M H2CO3 per second when the enzyme is fully saturated with substrate. Hence, kcat is 6 × 10⁵ s−1. This turnover number is one of the largest known. Each catalyzed reaction takes place in a time equal to, on average, 1/kcat, which is 1.7 μs for carbonic anhydrase. The turnover numbers of most enzymes with their physiological substrates range from 1 to 104 per second (Table 8.5).
|
Enzyme |
Turnover number (per second) |
|---|---|
|
Carbonic anhydrase |
600,000 |
|
3- |
280,000 |
|
Acetylcholinesterase |
25,000 |
|
Penicillinase |
2,000 |
|
Lactate dehydrogenase |
1,000 |
|
Chymotrypsin |
100 |
|
DNA polymerase I |
15 |
|
Tryptophan synthetase |
2 |
|
Lysozyme |
0.5 |
KM and Vmax also permit the determination of fES, the fraction of active sites filled. This relation of fES to KM and Vmax is given by the following equation:

kcat/KM is a measure of catalytic efficiency
When the substrate concentration is much greater than KM, the rate of catalysis is equal to Vmax, which is a function of kcat, the turnover number, as already described. However, most enzymes are not normally saturated with substrate. Under physiological conditions, the [S]/KM ratio is typically between 0.01 and 1.0. When [S] ≪ KM, the enzymatic rate is much less than kcat because most of the active sites are unoccupied. Is there a number that characterizes the kinetics of an enzyme under these more typical cellular conditions? Indeed there is, as can be shown by combining equations 13 and 19 to give

When [S] ≪ KM, the concentration of free enzyme [E], is nearly equal to the total concentration of enzyme [E]T; so

Thus, when [S] ≪ KM, the enzymatic velocity depends on the values of kcat/KM, [S], and [E]T. Under these conditions, kcat/KM is the rate constant for the interaction of S and E. The rate constant kcat/KM, called the specificity constant, is a measure of catalytic efficiency because it takes into account both the rate of catalysis with a particular substrate (kcat) and the nature of the enzyme–

231
How efficient can an enzyme be? We can approach this question by determining whether there are any physical limits on the value of kcat/KM. Note that the kcat KM ratio depends on k1, k−1, and kcat, as can be shown by substituting for KM.

Suppose that the rate of formation of product (kcat) is much faster than the rate of dissociation of the ES complex (k−1). The value of kcat/KM then approaches k1. Thus, the ultimate limit on the value of kcat/KM is set by k1, the rate of formation of the ES complex. This rate cannot be faster than the diffusion-
Circe effect
The utilization of attractive forces to lure a substrate into a site in which it undergoes a transformation of structure, as defined by William P. Jencks, an enzymologist, who coined the term.
A goddess of Greek mythology, Circe lured Odysseus’s men to her house and then transformed them into pigs.
The kcat/KM ratios of the enzymes superoxide dismutase, acetylcholinesterase, and triose phosphate isomerase are between 108 and 109 s−1 M−1. Enzymes that have kcat/KM ratios at the upper limits have attained kinetic perfection. Their catalytic velocity is restricted only by the rate at which they encounter substrate in the solution (Table 8.7). Any further gain in catalytic rate can come only by decreasing the time for diffusion of the substrate into the enzyme’s immediate environment. Remember that the active site is only a small part of the total enzyme structure. Yet, for catalytically perfect enzymes, every encounter between enzyme and substrate is productive. In these cases, there may be attractive electrostatic forces on the enzyme that entice the substrate to the active site. These forces are sometimes referred to poetically as Circe effects.
|
Enzyme |
kcat/KM (s−1 M−1) |
|---|---|
|
Acetylcholinesterase |
1.6 × 10⁸ |
|
Carbonic anhydrase |
8.3 × 10⁷ |
|
Catalase |
4 × 10⁷ |
|
Crotonase |
2.8 × 10⁸ |
|
Fumarase |
1.6 × 10⁸ |
|
Triose phosphate isomerase |
2.4 × 10⁸ |
|
β-Lactamase |
1 × 10⁸ |
|
Superoxide dismutase |
7 × 10⁹ |
|
Source: Information from A. Fersht, Structure and Mechanism in Protein Science: A Guide to Enzyme Catalysis and Protein Folding (W. H. Freeman and Company, 1999), Table 4.5. |
|
The diffusion of a substrate throughout a solution can also be partly overcome by confining substrates and products in the limited volume of a multienzyme complex. Indeed, some series of enzymes are organized into complexes so that the product of one enzyme is very rapidly found by the next enzyme. In effect, products are channeled from one enzyme to the next, much as in an assembly line.
Most biochemical reactions include multiple substrates
Most reactions in biological systems start with two substrates and yield two products. They can be represented by the bisubstrate reaction:

Many such reactions transfer a functional group, such as a phosphoryl or an ammonium group, from one substrate to the other. Those that are oxidation–
232
Sequential Reactions. In sequential reactions, all substrates must bind to the enzyme before any product is released. Consequently, in a bisubstrate reaction, a ternary complex of the enzyme and both substrates forms. Sequential mechanisms are of two types: ordered, in which the substrates bind the enzyme in a defined sequence, and random.
Many enzymes that have NAD+ or NADH as a substrate exhibit the ordered sequential mechanism. Consider lactate dehydrogenase, an important enzyme in glucose metabolism (Section 16.1). This enzyme reduces pyruvate to lactate while oxidizing NADH to NAD+.

In the ordered sequential mechanism, the coenzyme always binds first and the lactate is always released first. This sequence can be represented by using a notation developed by W. Wallace Cleland:

The enzyme exists as a ternary complex consisting of, first, the enzyme and substrates and, after catalysis, the enzyme and products.
In the random sequential mechanism, the order of the addition of substrates and the release of products is random. An example of a random sequential reaction is the formation of phosphocreatine and ADP from creatine and ATP which is catalyzed by creatine kinase (Section 15.2).

Either creatine or ATP may bind first, and either phosphocreatine or ADP may be released first. Phosphocreatine is an important energy source in muscle. Sequential random reactions also can be depicted in the Cleland notation.

Although the order of certain events is random, the reaction still passes through the ternary complexes including, first, substrates and, then, products.
233
Double-

The sequence of events can be portrayed as the following Cleland notation:

After aspartate binds to the enzyme, the enzyme accepts aspartate’s amino group to form the substituted enzyme intermediate. The first product, oxaloacetate, subsequently departs. The second substrate, α-ketoglutarate, binds to the enzyme, accepts the amino group from the modified enzyme, and is then released as the final product, glutamate. In the Cleland notation, the substrates appear to bounce on and off the enzyme much as a Ping-
Allosteric enzymes do not obey Michaelis–Menten kinetics
The Michaelis–

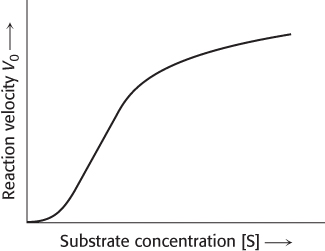
Allosteric enzymes often display sigmoidal plots of the reaction velocity V0 versus substrate concentration [S] (Figure 8.13), rather than the hyperbolic plots predicted by the Michaelis–
234