5.1 AreaPrinted Page 344
344
OBJECTIVES
When you finish this section, you should be able to:
In this section, we present a method for finding the area enclosed by the graph of a function y=f(x) that is nonnegative on a closed interval [a,b], the x-axis, and the lines x=a and x=b. The presentation uses summation notation (∑), which is reviewed in Appendix A.5.
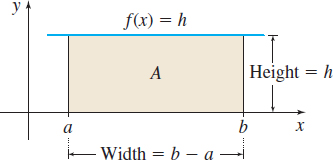
The area A of a rectangle with width w and height l is given by the geometry formula \bbox[5px, border:1px solid black, #F9F7ED]{\bbox[#FAF8ED,5pt]{A=lw}}
See Figure 2. The graph of a constant function f(x)=h, for some positive constant h, is a horizontal line that lies above the x-axis. The area enclosed by this line, the x-axis, and the lines x=a and x=b is the rectangle whose area A is the product of the width (b-a) and the height h. \bbox[5px, border:1px solid black, #F9F7ED]{\bbox[#FAF8ED,5pt]{A= h (b-a)}}
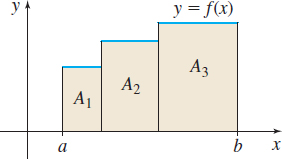
If the graph of y = f(x) consists of three horizontal lines, each of positive height as shown in Figure 3, the area A enclosed by the graph of f, the x-axis, and the lines x = a and x = b is the sum of the rectangular areas A_{1}, A_{2}, and A_{3}.
1 Approximate the Area Under the Graph of a FunctionPrinted Page 344
EXAMPLE 1Approximating the Area Under the Graph of a Function
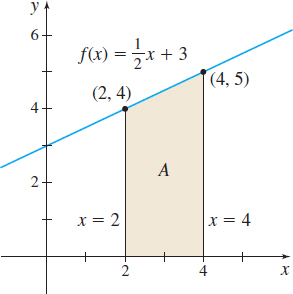
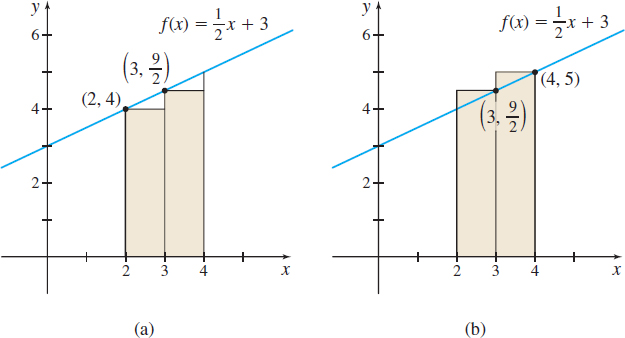
Approximate the area A enclosed by the graph of f(x) =\dfrac{1}{2}x+3, the x-axis, and the lines x=2 and x=4.
Solution Figure 4 illustrates the area A to be approximated.
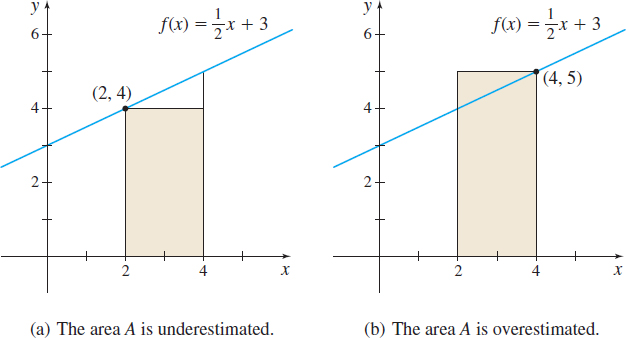
We begin by drawing a rectangle of width 4-2=2 and height f (2)=4. The area of the rectangle, 2\cdot 4=8, approximates the area A, but it underestimates A, as seen in Figure 5(a).
Alternatively, A can be approximated by a rectangle of width 4-2=2 and height f (4) =5. See Figure 5(b). This approximation of the area equals 2\cdot 5=10, but it overestimates A. We conclude that 8 \lt A \lt 10
345
The approximation of the area A can be improved by dividing the closed interval [2, 4] into two subintervals, [2, 3] and [3, 4]. Now we draw two rectangles: one rectangle with width 3-2=1 and height f(2) =\dfrac{1}{2}\cdot 2+3=4; the other rectangle with width 4-3=1 and height f (3) =\dfrac{1}{2} \cdot 3+3=\dfrac{9}{2}. As Figure 6(a) illustrates, the sum of the areas of the two rectangles 1\cdot 4+1\cdot \dfrac{9}{2}=\dfrac{17}{2}=8.5 underestimates the area.
Now we repeat this process by drawing two rectangles,one of width 1 and height f(3) =\dfrac{9}{2}; the other of width 1 and height f(4) =\dfrac{1}{2}\cdot 4+3=5. As Figure 6(b) illustrates, the sum of the areas of these two rectangles, 1\cdot \dfrac{9}{2}+1\cdot 5=\dfrac{19}{2}=9.5
overestimates the area. We conclude that 8.5\lt A\lt9.5
obtaining a better approximation to the area.
NOTE
The actual area in Figure 4 is 9 square units, obtained by using the formula for the area A of a trapezoid with base b and parallel heights h_{1} and h_{2}: A = \dfrac{1}{2}b (h_{1} +h_{2}) =\dfrac{1}{2}(2) (4+5) = 9.
Observe that as the number n of subintervals of the interval increases, the approximation of the area A improves. For n=1, the error in approximating A is 1 square unit, but for n=2, the error is only 0.5 square unit.
NOW WORK
In general, the procedure for approximating the area A is based on the idea of summing the areas of rectangles. We shall refer to the area A enclosed by the graph of a function y=f(x)\geq 0, the x-axis, and the lines x = a and x = b as the area under the graph of \boldsymbol{f} from \boldsymbol{a} to \boldsymbol{b}.
We make two assumptions about the function f:
- f is continuous on the closed interval [a,b].
- f is nonnegative on the closed interval [a,b].
We divide, or partition, the interval [a,b] into n nonoverlapping subintervals: \lbrack x_{0}, x_{1}], [x_{1}, x_{2}],\ldots , [x_{i-1},x_{i}],\ldots , [x_{n-1}, x_{n}]
346
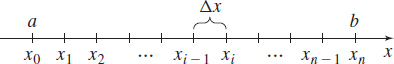
each of the same length. See Figure 7. Since there are n subintervals and the length of the interval [a,b] is b-a, the common length \Delta x of each subinterval is \bbox[5px, border:1px solid black, #F9F7ED]{\bbox[#FAF8ED,5pt]{\Delta x=\dfrac{b-a}{n}}}
NEED TO REVIEW?
The Extreme Value Theorem is discussed in Section 4.2, p. 265.
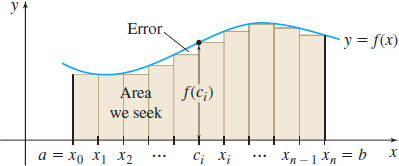
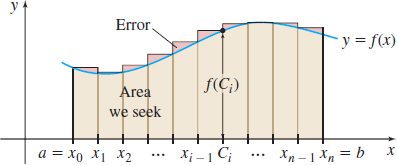
Since f is continuous on the closed interval [a,b], it is continuous on every subinterval [x_{i-1}, x_{i}] of [a,b]. By the Extreme Value Theorem, there is a number in each subinterval where f attains its absolute minimum. Label these numbers c_{1}, c_{2}, c_{3},\ldots , c_{n}, so that f(c_{i}) is the absolute minimum value of f in the subinterval [x_{i-1}, x_{i}]. Now construct n rectangles, each having \Delta x as its base and f(c_{i}) as its height, as illustrated in Figure 8. This produces n narrow rectangles of uniform width \Delta x=\dfrac{b-a}{n} and heights f(c_{1}) , f(c_{2}), \ldots, f(c_{n}) , respectively. The areas of the n rectangles are
\begin{eqnarray*} \text{Area of the first rectangle} &=&f(c_{1})\Delta x \\ \text{Area of the second rectangle} &=&f(c_{2})\Delta x \\ &\vdots & \\ \text{Area of the }n\text{th} \text{ (and last) rectangle} &=&f(c_{n})\Delta x \end{eqnarray*}
The sum s_{n} of the areas of the n rectangles approximates the area A. That is,
A\approx s_{n}=f(c_{\mathbf{1}})\Delta x+f(c_{\mathbf{2}})\Delta x+~\cdots ~+f(c_{i})\Delta x+~\cdots ~+f(c_{n})\Delta x=\sum\limits_{i= 1}^{n}f(c_{i})\Delta x
NEED TO REVIEW?
Summation notation is discussed in Appendix A.5, pp. A-38 to A-43.
Since the rectangles used to approximate the area A lie under the graph of f, the sum s_{n}, called a lower sum, underestimates A . That is, \ s_{n}\leq A.
EXAMPLE 2Approximating Area Using Lower Sums
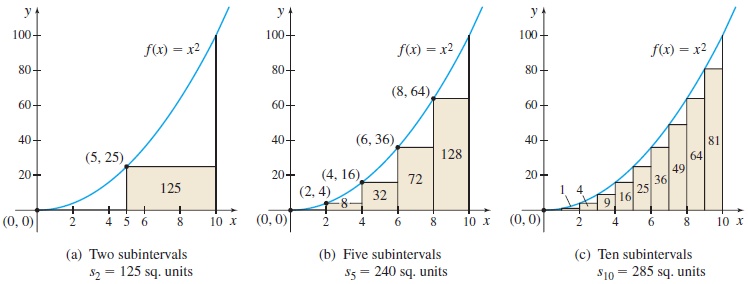
Approximate the area A under the graph of f(x) = x^{2} from 0 to 10 by using lower sums s_{n} (rectangles that lie under the graph) for:
- (a) n = 2 subintervals
- (b) n = 5 subintervals
- (c) n = 10 subintervals
Solution (a) For n=2, we partition the closed interval [0,10] into two subintervals [0,5] and [5,10], each of length \Delta x=\dfrac{10-0}{2}=5. See Figure 9(a). To compute s_{2}, we need to know where f attains its minimum value in each subinterval. Since f is an increasing function, the absolute minimum is attained at the left endpoint of each subinterval. So, for n=2, the minimum of f on [0,5] occurs at 0 and the minimum of f on [5,10] occurs at 5. The lower sum s_{2} is
347
s_{2}=\sum\limits_{i=1}^{2}~f(c_{i})\Delta x=\Delta x\sum\limits_{i=1}^{2}f(c_{i}) \underset{\underset{\underset{\color{#0066A7}{f\left(c_{1}\right) =f\left( 0\right);f\left( c_{2}\right) =f\left(5\right)}}{\color{#0066A7}{\Delta x=5}}}{\color{#0066A7}{\uparrow}}}{=}5\,\left[ ~f(0)+f(5)\right] \underset{\underset{\underset{\color{#0066A7}{f(5)=25}}{\color{#0066A7}{f(0)=0}}}{\color{#0066A7}{\uparrow}}}{=}5(0+25)=125
(b) For n=5, partition the interval [0,10] into five subintervals [0,2] , [2,4] , [4,6] , [6,8] , [8,10], each of length \Delta x = \dfrac{10-0}{5}=2. See Figure 9(b). The lower sum s_{5} is \begin{eqnarray*} s_{5} &=&\sum\limits_{i=1}^{5} f(c_{i})\Delta x=\Delta x\sum\limits_{i=1}^{5}f(c_{i})=2 [ f(0)+f(2)+f(4) +f(6)+f(8)] \\ &=&2(0+4+16+36+64)=240 \end{eqnarray*}
(c) For n=10, partition [0,10] into 10 subintervals, each of length \Delta x=\dfrac{10-0}{10}=1. See Figure 9(c). The lower sum s_{10} is \begin{eqnarray*} s_{10} &=&\sum\limits_{i=1}^{10} f(c_{i})\Delta x=\Delta x\sum\limits_{i=1}^{10}f(c_{i})=1[ f(0)+f(1)+f(2)+\cdots +f(9) ] \\ &=&0+1+4+9+16+25+36+49+64+81=285 \end{eqnarray*}
NOW WORK
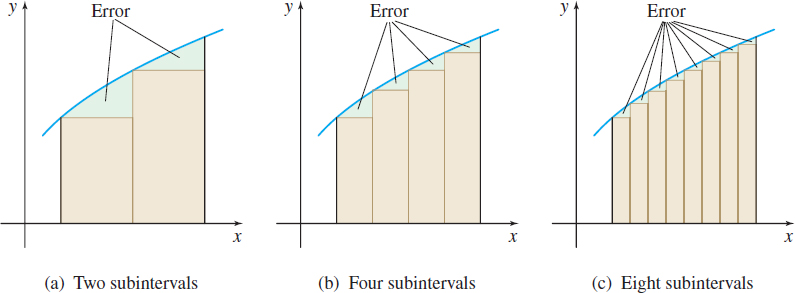
In general, as Figure 10(a) illustrates, the error due to using lower sums s_{n} (rectangles that lie below the graph of f) occurs because a portion of the area lies outside the rectangles. To improve the approximation of the area, we increase the number of subintervals. For example, in Figure 10(b), there are four subintervals and the error is reduced; in Figure 10(c), there are eight subintervals and the error is further reduced. So, by taking a finer and finer partition of the interval [a,b], that is, by increasing n, the number of subintervals, without bound, we can make the sum of the areas of the rectangles as close as we please to the actual area. (A proof of this statement is usually found in books on advanced calculus.)
In Section 5.2, we see that, for functions that are continuous on a closed interval, \lim\limits_{n\rightarrow \infty }s_{n} always exists. With this discussion in mind, we now define the area under the graph of a function f from a to b.
348
DEFINITION Area A Under the Graph of a Function from a to b
Suppose a function f is nonnegative and continuous on a closed interval [a,b] . Partition [a,b] into n subintervals [ x_{0},x_{1}] , [ x_{1},x_{2}] , \ldots , [ x_{i-1},x_{i}] , \ldots , [ x_{n-1},x_{n}] ,each of length \Delta x=\dfrac{b-a}{n}
In each subinterval [ x_{i-1},x_{i}] , let f (c_{i}) equal the absolute minimum value of f on this subinterval. Form the lower sums s_{n}=\sum\limits_{i= 1}^{n}f({\rm c_{i}})\Delta x=f({\rm c}_{\mathbf{1}})\Delta x+ \cdots +f(c_{n})\Delta x
The area A under the graph of f from a to b is the number \bbox[5px, border:1px solid black, #F9F7ED]{\bbox[5pt] {A=\lim\limits_{n\rightarrow \infty }s_{n} }}
The area A is defined using lower sums s_{n} (rectangles that lie below the graph of f). By a parallel argument, we can choose values C_{1}, C_{2}, \ldots , C_{n} so that the height f (C_{i}) of the ith rectangle is the absolute maximum value of f on the ith subinterval, as shown in Figure 11. The corresponding upper sums S_{n} (rectangles that lie above the graph of f) overestimates the area A. So, S_{n}\geq A. It can be shown that as n increases without bound, the limit of the upper sums S_{n} equals the limit of the lower sums s_{n}. That is, \bbox[5px, border:1px solid black, #F9F7ED]{\bbox[#FAF8ED,5pt]{\lim\limits_{n\rightarrow \infty}s_{n}=\lim\limits_{n\rightarrow \infty }S_{n}=A }}
2 Find the Area Under the Graph of a FunctionPrinted Page 348
In the next example, instead of using a specific number of rectangles to approximate area, we partition the interval [a,b] into n subintervals, obtaining n rectangles. By letting n\rightarrow \infty , we find the actual area under the graph of f from a to b.
EXAMPLE 3Finding Area Using Upper Sums
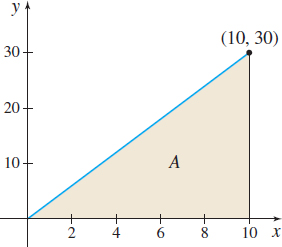
Find the area A under the graph of f(x) = 3x from 0 to 10 using upper sums S_{n} (rectangles that lie above the graph of f). Then A = \lim\limits_{n\rightarrow \infty }S_{n}.
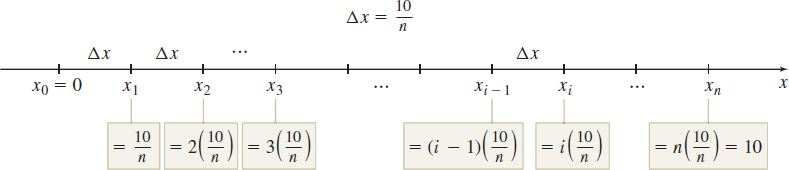
Solution Figure 12 illustrates the area A. We partition the closed interval [0,10] into n subintervals {[{x_{0},x_{1}}]}, {[{x_{1},x_{2}}]}, \ldots, [x_{i-1},x_{i}] , \ldots , {{[{x_{n-1},x_{n}}]}}
where 0=x_{0}\lt x_{1}\lt x_{2}\lt \cdots \lt x_{i}\lt \cdots \lt x_{n-1}\lt x_{n}=10
and each subinterval is of length \Delta x = {\dfrac{{10 - 0}}{{n}}} = {\dfrac{{10}}{{n}}}
The coordinates of the endpoints of each subinterval, written in terms of n, are \begin{eqnarray*} x_{0} &=& 0,\ x_{1}={\dfrac{{10}}{{n}}},\ x_{2}=2\left( {{\dfrac{{10}}{{n}}}}\right), \ldots , x_{i-1}=(i-1) \left( {{\dfrac{{10}}{{n}}}}\right), \\ x_{i} &=& i\left( {{\dfrac{{10}}{{n}}}}\right), \ldots , x_{n}=n\left( {{\dfrac{{10}}{{n}}}}\right) =10 \end{eqnarray*}
as illustrated in Figure 13.
349
To find A using upper sums S_{n} (rectangles that lie above the graph of f), we need the absolute maximum value of f in each subinterval. Since f(x)=3x is an increasing function, the absolute maximum occurs at the right endpoint x_{i}= i\left(\dfrac{10}{n}\right) of each subinterval. So,
NEED TO REVIEW?
Summation properties are discussed in Appendix A.5, pp. A-38 to A-43.
\begin{eqnarray*} S_{n}=\sum\limits_{i=1}^{n} f (C_i)\Delta x \underset{\underset{{\color{#0066A7}{\hbox{\( \Delta x = \dfrac{10}{n}\)}}}}{\color{#0066A7}{\uparrow}}}{=} \sum \limits_{i=1}^{n}3x_{i}\cdot \dfrac{10}{n} \underset{\underset{{\color{#0066A7}{\hbox{\( {x}_{i} = \dfrac{10i}{n}\)}}}}{\color{#0066A7}{\uparrow}}}{=} {\sum\limits_{i=1}^{n}}\left( 3\cdot \dfrac{10i}{n}\right) \left( \dfrac{10}{n}\right) = \sum\limits_{i=1}^{n}\dfrac{300}{n^2}i \end{eqnarray*}
Using summation properties, we get
RECALL
\sum\limits_{i=1}^{n}i=\dfrac{n(n+1) }{2}
S_{n}= \sum\limits_{i=1}^{n} \dfrac{300}{n^2} i =\dfrac{300}{n^2} \sum\limits_{i=1}^{n} i = \dfrac{300}{n^2}\ \dfrac{n(n+1)}{2} = 150\left(\dfrac{n+1}{n}\right) =150\left(1+\dfrac{1}{n}\right)
Then A=\lim\limits_{n\rightarrow \infty }S_{n}=\lim\limits_{n\rightarrow \infty } \left[150 \left( 1+\dfrac{1}{n} \right) \right] =150\lim\limits_{n\rightarrow \infty }\left(1+\dfrac{1}{n}\right) = 150
The area A under the graph of f(x)=3x from 0 to 10 is 150 square units.
NOTE The area found in Example 3 is that of a triangle. So, we can verify that A=150 by using the formula for the area A of a triangle with base b and height h: A=\dfrac{1}{2}bh = \dfrac{1}{2} (10)(30) = 150

EXAMPLE 4Finding Area Using Lower Sums
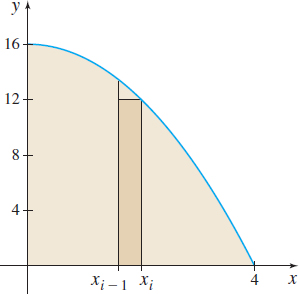
Find the area A under the graph of f(x) = 16 - x^{2} from 0 to 4 by using lower sums s_{n} (rectangles that lie below the graph of f). Then A=\lim\limits_{n\rightarrow \infty }{}s_{n}.
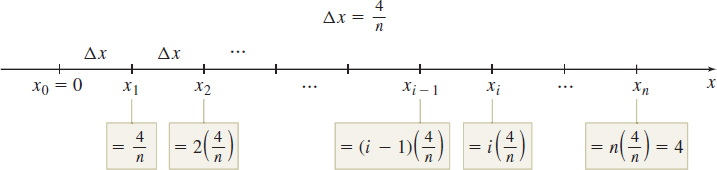
Solution Figure 14 shows the area under the graph of f and a typical rectangle that lies below the graph. We partition the closed interval [0,4] into n subintervals {[{x_{0},x_{1}}]}, {[{x_{1},x_{2}}]}, \ldots , [x_{i-1},x_{i}], \ldots , {[{x_{n-1},x_{n}}]}
where 0=x_{0}\lt x_{1}\lt\cdots \lt x_{i}\lt\cdots \lt x_{n-1}\lt x_{n}=4
and each interval is of length \Delta x = \dfrac{{4-0}}{n} = \dfrac{4}{n}
As Figure 15 on page 350 illustrates, the endpoints of each subinterval, written in terms of n, are \begin{eqnarray*} x_{0} &=& 0,\ x_{1}=1\left( \dfrac{4}{n}\right)\!,\ x_{2}=2\left( {{\dfrac{{4}}{{n}}}}\right), \ldots , x_{i-1}=(i-1) \left( {{\dfrac{{4}}{{n}}}}\right), \\ x_{i} &=& i\left( {{\dfrac{{4}}{{n}}}} \right)\!, \ldots , x_{n}=n\left( {{\dfrac{{4}}{{n}}}}\right) =4 \end{eqnarray*}
350
To find A using lower sums s_{n} (rectangles that lie below the graph of f), we must find the absolute minimum value of f on each subinterval. Since the function f is a decreasing function, the absolute minimum occurs at the right endpoint of each subinterval. So, s_{n}={\sum\limits_{i=1}^{n}} f (c_{i})\Delta x
Since c_{i}=i \left( \dfrac{4}{n}\right) =\dfrac{4i}{n} and \Delta x=\dfrac{4}{n}, we have
RECALL
\sum\limits_{i=1}^{n} 1=n; \sum\limits_{i=1}^{n} {i}^{2} = \dfrac{{n}({n+1}) (2n+1)}{6}
\begin{eqnarray*} s_{n} &=&\sum\limits_{i=1}^{n}f(c_{i})\Delta x = \sum \limits_{i=1}^{n}\left[ {16-{{\left( {{\dfrac{{4i}}{{n}}}}\right) }}^{2}} \right] \left( {{\dfrac{{4}}{{n}}}}\right) {\color{#0066A7}{(c_i = \dfrac{4i}{n}); f(c_{i}) = 16 - c_{i}^{2}}}\\ &=& \sum\limits_{i=1}^{n}\left[ \dfrac{64}{n}-\dfrac{64i^{2}}{n^{3}}\right] \\ &=& \dfrac{64}{n}{{{\sum\limits_{i=1}^{n}1}}}-\dfrac{64}{n^{3}}\sum\limits_{i=1}^{n}i^{2} \\ &=& \dfrac{64}{n}(n) -\dfrac{64}{n^{3}}\left[ \dfrac{n(n+1) (2n+1) }{6}\right] = 64-\dfrac{32}{3n^{2}}\left[ 2n^{2}+3n+1\right] \\ &=& 64-\dfrac{64}{3}-\dfrac{32}{n}-\dfrac{32}{3n^{2}}=\dfrac{128}{3}-\dfrac{32}{n}-\dfrac{32}{3n^{2}} \end{eqnarray*}
Then A=\lim\limits_{n\rightarrow \infty }s_{n}={\lim\limits_{n\rightarrow \infty }}\left( {{\dfrac{{128}}{{3}}}}-{{\dfrac{{32}}{{n}}}-{\dfrac{{32}}{{3n^{2}}}}}\right) ={\dfrac{{128}}{{3}}}
The area A under the graph of f (x) =16-x^{2} from 0 to 4 is \dfrac{128}{3} square units.
NOW WORK
The previous two examples illustrate just how complex it can be to find areas using lower sums and/or upper sums. In the next section, we define an integral and show how it can be used to find area. Then in Section 5.3, we present the Fundamental Theorem of Calculus, which provides a relatively simple way to find area.