12.1 Functions of Two or More Variables and Their GraphsPrinted Page 810
810
1 Work with Functions of Two or Three VariablesPrinted Page 810
Many applications of the physical sciences, biology, the social sciences, business and economics, and even sports require functions of two or more variables. For example, the monthly cost of using a netbook depends on the megabytes of data used domestically, the number of kilobytes of data sent to or received from Canada, and the number of kilobytes of data used outside the United States and Canada. The cost is a function of three variables. For another example, the volume V =πR2h of water stored in a cylindrical tank depends on both the height h of the water and the radius R of the tank. The volume V is a function of two variables, R and h. In function notation, V=f(R,h)=πR2h
So, if R=10 centimeters (cm) and h=3 cm, then the volume of water in the tank is V=f(10,3)=π(102)(3)=300π cubic centimeters (cm3).
DEFINITION Function of Two Variables
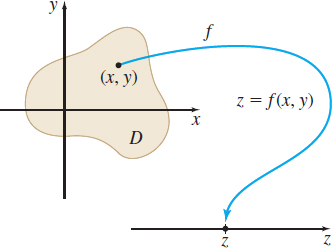
Let D be a nonempty subset of the xy-plane. A function f of two variables x and y is a rule that associates with each point (x,y) of D a unique real number z=f(x,y).
The function z=f(x,y) has two independent variables x and y, and one dependent variable z. The domain D of the function f is the set of points in the xy-plane for which the function is defined. The range of f is the set of real numbers z=f(x,y), where (x,y) is in D. Figure 1 illustrates how the point (x,y) is mapped to the number z=f(x,y).
EXAMPLE 1Evaluating a Function of Two Variables
Let f(x,y)=√x+x√y. Find:
- (a) f(1,4)
- (b) f(a2,9b2), a>0, b>0
- (c) f(x+Δx,y)
- (d) f(x,y+Δy)
Solution (a) f(1,4)=√1+1√4=1+2=3 x=1;y=4.
(b)f(a2,9b2)=√a2+a2√9b2=a+3a2bx=a2;y=9b2;a>0;b>0.
(c) f(x+Δx,y)=√x+Δx+(x+Δx)√y
(d) f(x,y+Δy)=√x+x√y+Δy
NOW WORK
DEFINITION Function of Three Variables
Let D be a nonempty set of points in space. A function f of three variables x,y, and z is a rule that associates with each point (x,y,z) of D a unique real number w=f(x,y,z).
811
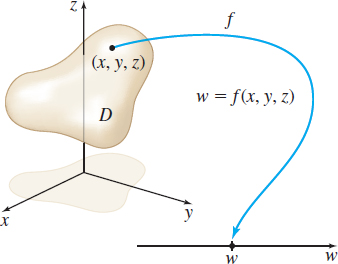
The function w=f(x,y,z) has three independent variables x, y, and z and one dependent variable w. The domain D of the function f is the set of points in space for which the function is defined, and the range of f is the set of real numbers w=f(x,y,z) for points (x,y,z) in D. See Figure 2.
Functions of n variables, where n is a positive integer, are defined similarly. A function f of n variables x1,x2,…,xn is a rule that associates a unique real number z=f(x1,x2,…,xn) with each point (x1,x2,…,xn) in a nonempty subset D of n-dimensional space. Here, z is the dependent variable and x1,x2,…,xn are the n independent variables.
Collectively, functions of two or more variables are referred to as functions of several variables. As with functions of a single variable, a function of several variables is usually given by a formula, and unless the domain is specified, the domain is the largest set of points for which the dependent variable is a real number.
Functions of several variables are expressed explicitly when they are in the form z=f(x,y)w=g(x,y,z)z=h(x1,x2,⋯,xn)
or implicitly when they are in the form F(x,y,z)=0G(x,y,z,w)=0H(x1,x2,⋯,xn,z)=0
EXAMPLE 2Finding the Domain of a Function of Two Variables
Find the domain of each of the following functions. Then graph the domain.
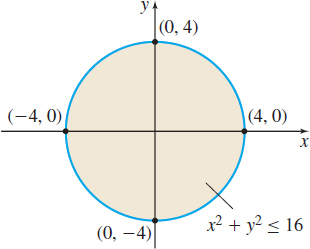
- (a) z=f(x,y)=√16−x2−y2
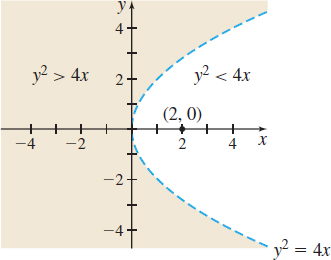
- (b) z=f(x,y)=ln(y2−4x)
Solution (a) Since the expression under the radical must be nonnegative, the domain of f consists of all points in the plane for which 16−x2−y2≥0x2+y2≤16
The domain is all the points inside and on the circle x2+y2=16. The shaded portion of Figure 3 illustrates the domain.
(b) Since the logarithmic function is defined for only positive numbers, the domain of f is the set of points (x,y) for which y2−4x>0 or y2>4x. To graph the domain, we start with the parabola y2=4x, and use a dashed curve to indicate that the parabola is not part of the domain. The parabola y2=4x divides the plane into two sets of points: those for which y2<4x and those for which y2>4x. To find which points are in the domain, choose any point not on the parabola y2=4x and determine whether it satisfies the inequality. For example, the point (2,0) is not in the domain, since 02<(4)(2). The set of points for which y2>4x, the domain of f, is shaded in Figure 4.
NOW WORK
812
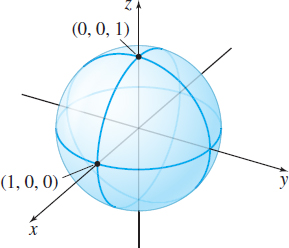
EXAMPLE 3Finding the Domain of a Function of Three Variables
Find the domain of the function w=f(x,y,z)=√x2+y2+z2−1 and graph the domain.
Solution Since the expression under the radical must be nonnegative, the domain of f consists of all points for which x2+y2+z2−1≥0. The domain is the set of all points on and outside of the unit sphere x2+y2+z2=1; that is, the set {(x,y,z)|x2+y2+z2≥1}. See Figure 5.
NOW WORK
2 Graph Functions of Two VariablesPrinted Page 812
The graph of a function z=f(x,y) of two variables is called a surface and consists of all points (x,y,z) for which z=f(x,y), and (x,y) is in the domain of f. We use the graphing techniques introduced in Chapter 10 to graph functions of two variables.
EXAMPLE 4Graphing a Function of Two Variables
Graph each function:
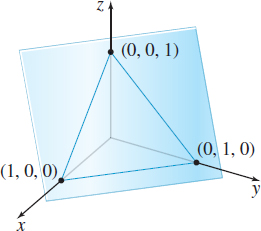
- (a) z=f(x,y)=1−x−y
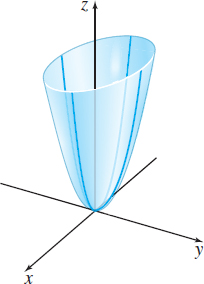
- (b) z=f(x,y)=x2+4y2
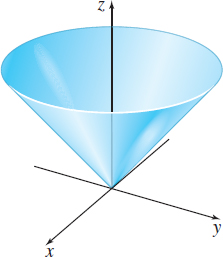
- (c) z=f(x,y)=√x2+y2
NEED TO REVIEW?
Planes in space are discussed in Section 10.6, pp. 737-740.
Solution (a) The graph of the equation z=1−x−y, or x+y+z=1, is a plane. The intercepts are the points (1,0,0), (0,1,0), and (0,0,1). See Figure 6.
(b) The graph of the equation z=x2+4y2 is an elliptic paraboloid whose vertex is at the origin. See Figure 7.
NEED TO REVIEW?
Quadric surfaces are discussed in Section 10.7, pp. 744-751.
(c) The equation z=f(x,y)=√x2+y2 is equivalent to z2=x2+y2, where z≥0. The graph of the equation is part of a circular cone whose vertex is at the origin. Since z≥0, the graph of f is the upper nappe of the cone. See Figure 8.
NOW WORK
3 Graph Level CurvesPrinted Page 812
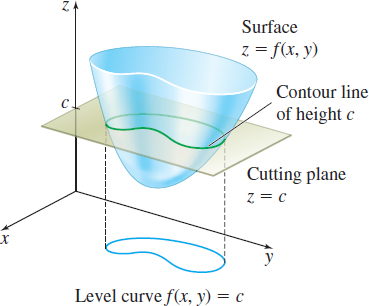
The graph of a function f of two variables is usually difficult to draw by hand. In practice, such as in topography, the surface z=f(x,y) is conveyed by drawing properly labeled curves for fixed values of z. These curves are called contour lines and each contour line corresponds to the intersection of the surface z=f(x,y) and a plane z=c, where c is a constant.
813
For example, suppose the surface is a mountain whose height is measured in meters, and z=0 represents sea level. Then by walking along the contour line z=500, we would be walking on a level path 500 m above sea level.
NOTE
A contour line is equivalent to a trace used to describe a quadric surface in Chapter 10. Recall that a trace is the intersection of a surface with a coordinate plane or a plane parallel to a coordinate plane.
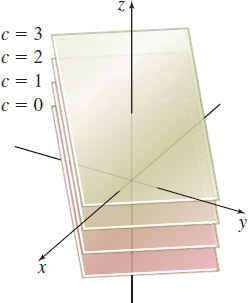
When a contour line is projected onto the xy-plane, the resulting graph is called a level curve. See Figure 9.
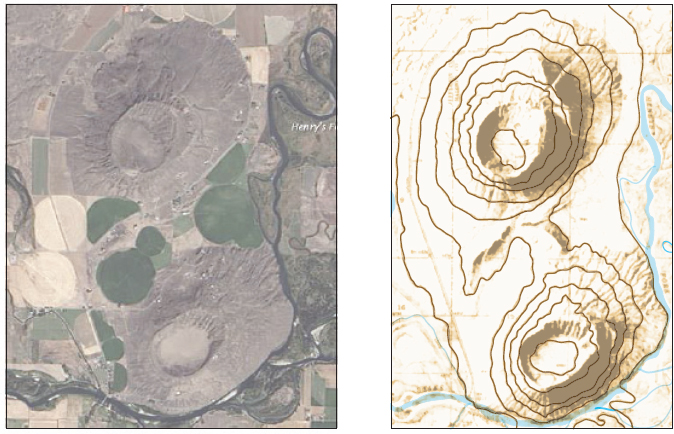
In a topographical map, a series of level curves are drawn, each representing a contour line of height (or depth) c. For example, to represent a hilly terrain, a topographer draws level curves corresponding to contour lines for various heights measured at equal intervals, say, every 100 m. When the level curves are close to each other, the terrain is steep; when they are further apart, the terrain is flatter. See Figure 10.
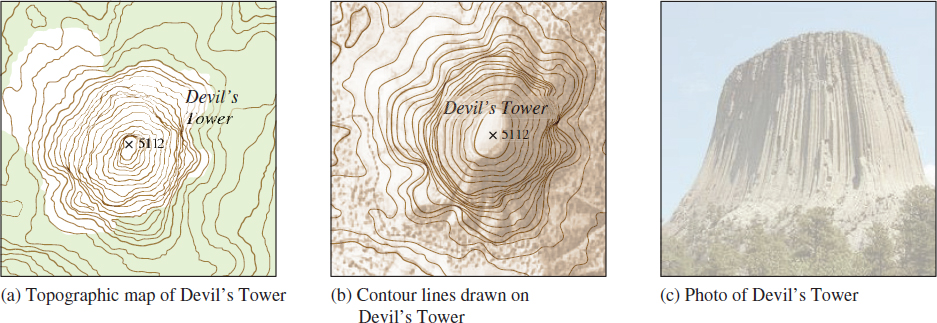
So by reversing the process, we can visualize a surface by mentally raising each level curve to its corresponding height z and viewing the resulting contour lines. Figure 11 shows this process. Figure 11(a) is a U.S. geological survey topographic map of Devil’s Tower, a monolith in Wyoming. Observe how the level curves are close together, indicating that the surface is steep on all sides. Figure 11(b) shows the contour lines drawn on the monolith. Figure 11(c) is a photograph of Devil’s Tower.
Level curves are used by meteorologists to indicate points at which barometric pressure is fixed (isobars), to illustrate places at which wind speed remains constant (isolines), and to show temperature bands (isotherms).
IN WORDS
The prefix iso- is Greek meaning “same.”
814
EXAMPLE 5Graphing Level Curves
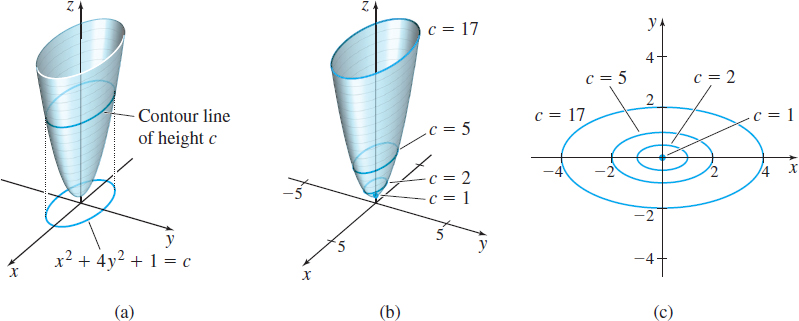
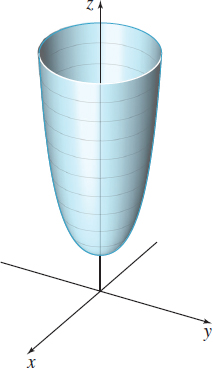
Graph the level curves of the function z=f(x,y)=x2+4y2+1 for c=1,2,5, and 17.
Solution Here, we recognize the graph of f to be an elliptic paraboloid, as shown in Figure 12. Since z≥1, the level curves of f consist of the graphs of x2+4y2=c−1, c≥1. Figure 13(a) shows the elliptic paraboloid and a level curve x2+4y2+1=cc>1
Figure 13(b) shows the elliptic paraboloid z=x2+4y2+1 with several contour lines marked. The level curves for c=1 [the point (0,0)], c=2,c=5, and c=17 are then graphed in Figure 13(c). Notice that the level curves are concentric ellipses. You should be able to see how the elliptic paraboloid evolves from the collection of its level curves.


NOW WORK
EXAMPLE 6Graphing Level Curves
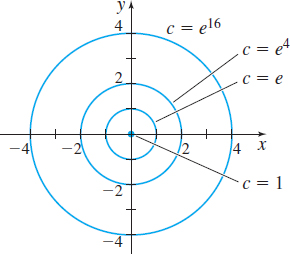
Graph the level curves of the function z=f(x,y)=ex2+y2 for c=1,e,e4, and e16.
Solution Because x2+y2≥0, it follows that z≥e0=1. The level curves satisfy the equation ex2+y2=c or x2+y2=lnc,where c≥1. For c=1, the level curve is the point (0,0). If c>1, the level curves are concentric circles. Figure 14 illustrates several level curves of f. A graph of the surface z=ex2+y2 is given in Figure 15. Do you see how the graph evolved from the collection of its level curves?
NOW WORK
4 Describe Level SurfacesPrinted Page 815
815
The graph of a function w=f(x,y,z) of three variables consists of all points (x,y,z,w) for which w=f(x,y,z) and (x,y,z) is in the domain of f. We cannot draw the graph of a function of three variables because it requires four dimensions. But we can visualize the graph by examining its level surfaces, that is, the surfaces obtained by letting w equal a constant.
EXAMPLE 7Describing Level Surfaces
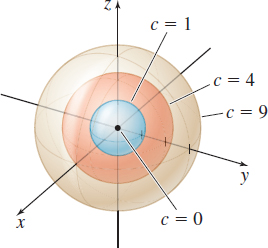
Describe the level surfaces of the function w=f(x,y,z)=x2+y2+z2.
Solution Since w≥0, the level surfaces are the graphs of x2+y2+z2=cc≥0
These are concentric spheres if c>0 and the origin if c=0. See Figure 16.
NOW WORK
EXAMPLE 8Describing Level Surfaces
Describe the level surfaces of the function w=f(x,y,z)=2x+3y+z.
Solution The level surfaces are the graphs of 2x+3y+z=c
This is a collection of parallel planes, each plane having the vector N=2i+3j+k as normal. See Figure 17.